
The Jordan, Knauff & Company (JKC) Valve Stock Index was up 10.9 percent over the last twelve months, while the broader S&P 500 Index was up 13.8 percent. The JKC Pump Stock Index increased 4.7 percent for the same time period.1
The Institute for Supply Management’s Purchasing Managers’ Index (PMI) increased from 56.3 percent in July to 58.8 percent in August. The indices for new orders and production were above 60 percent for the third straight month. The employment index grew at it strongest pace since June 2011, up from 55.2 percent to 59.9 percent. Survey respondents cited healthy gains in sales and an optimistic business outlook. The Bureau of Labor Statistics reported that manufacturers added 36,000 net new workers in August, its fastest monthly gain in five years and increasing for the third consecutive month.
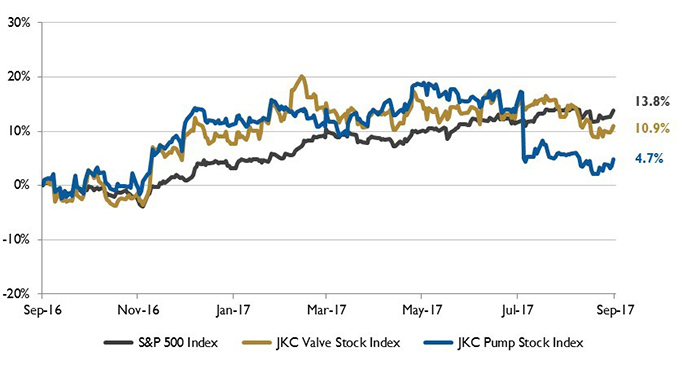 Figure 1. Stock Indices from August 1, 2016 to July 31, 2017. Local currency converted to USD using historical spot rates. The JKC Pump and Valve Stock Indices include a select list of publicly traded companies involved in the pump and valve industries weighted by market capitalization. Source: Capital IQ and JKC research.
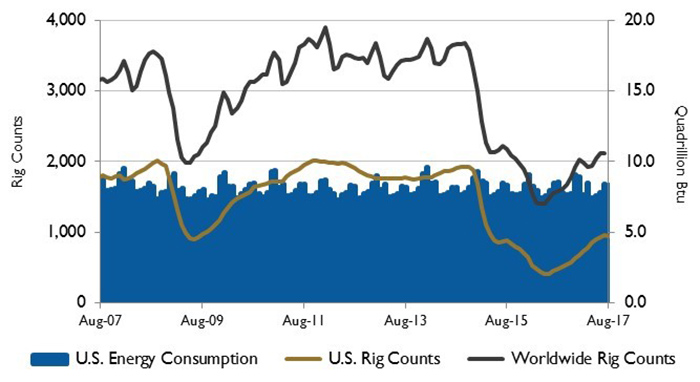 Figure 2. U.S. energy consumption and rig counts. Source: U.S. Energy Information Administration and Baker Hughes Inc.
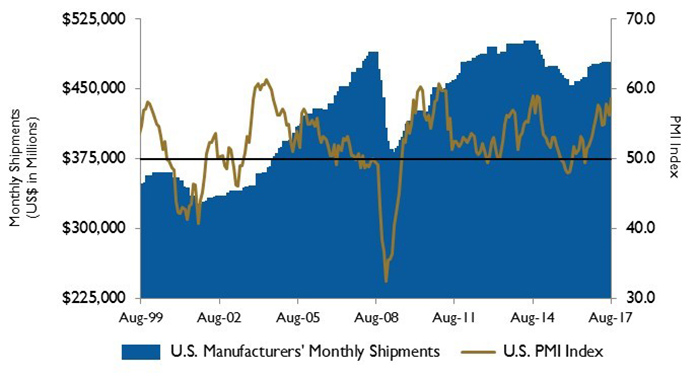 Figure 3. U.S. PMI and manufacturing shipments. Source: Institute for Supply Management Manufacturing Report on Business and U.S. Census Bureau
Pump Market Analysis
Jordan, Knauff & Company
10/17/2017
