

Frequently overlooked by end users, the manufacturer’s pump curve can be a useful tool to manage the reliability of the equipment and, subsequently, the system. Depending on your technical knowledge and experience, the pump curve may be perceived as both simple and obvious information, and/or it may be viewed as confusing “gobbledygook,” consequently to be discarded or ignored. The intention of this month’s column is to illustrate how to use this handy dandy tool in ways that you have not thought of before.
As an added perspective, the curves are also the manufacturer’s promise to you—a sort of covenant, if you please—based on actual performance tests, empirical data and calculations conducted at their facility.
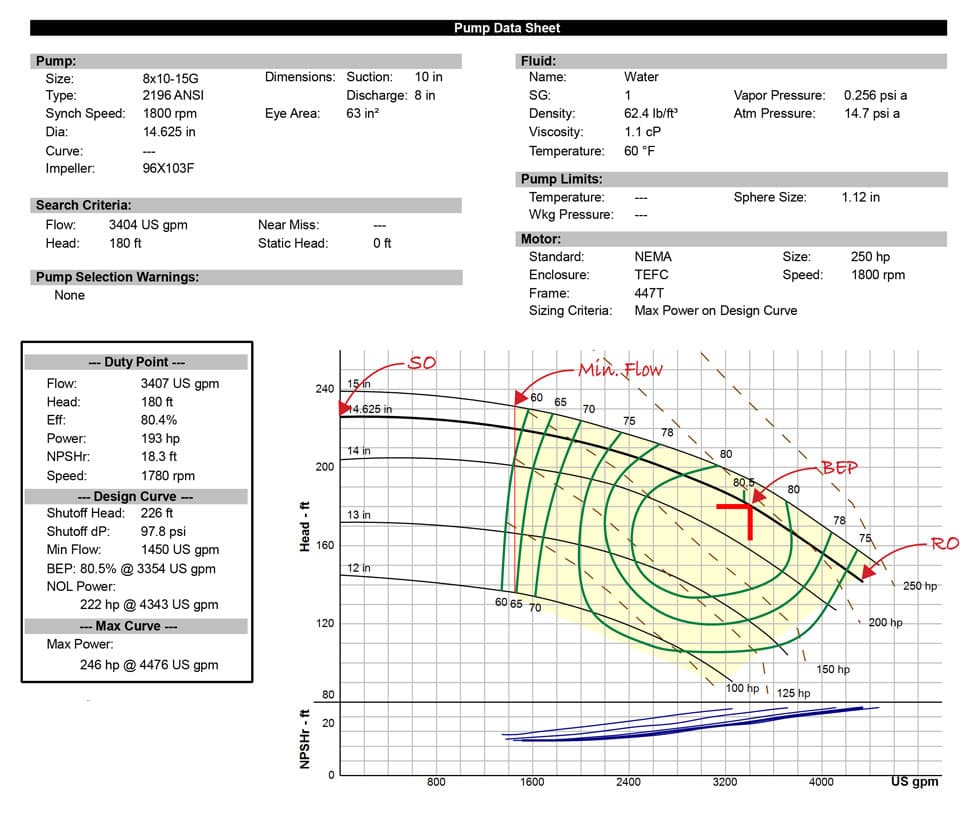 IMAGE 1: Pump data sheet (Image courtesy of author)
See Image 1 for a simple example of a typical published pump curve. Ask yourself, how many things does the curve really tell you? Let’s examine a list of some obvious and potentially not-so-obvious information that is communicated by this simple plot.
This is not a column on how to read a pump curve, though it may assist you in that endeavor. This two-part column is more about looking at the pump curve in a new and different way.
The Head vs. Capacity Curve
A simple pump curve can provide a plethora of useful information and there are many data points to be directly gleaned—there are things the curve tells you and there are things it does not. The curve will tell you the potential range of head and flow rates where the pump is capable of operating, but it doesn’t tell you specifically where it will operate on that curve. You will need help from the system curve for that information, because the pump will operate exactly where the system curve tells it to operate, if it is capable of operating at that point.
Basic Points Defined
The head-capacity curve illustrates and defines the head and corresponding flow rate that the pump is capable of for the stated impeller diameters and speeds (in this example the impeller is trimmed to 14.625 inches, just short of the maximum 15-inch impeller). You may think of how the set of curves illustrates an “operating envelope” per se (see yellow shaded area). To take the concept one step further, it also partially defines the acceptable, reliable and safe operating envelope.
Shut-Off Head
From the set of head-capacity curves you can easily determine the shut-off (SO) head for a given impeller diameter and speed. SO head is that point of maximum developed head at zero flow and at the far left of the curve, where the curve intersects the “Y” (vertical) axis. In our example, the SO head is 226 feet. This is a parameter usually garnered in the field by operating the pump with a closed discharge valve, which is also not a good place to operate the pump for more than a few seconds. But, in that brief and interim operating position at SO, it does tell you a lot of information about the pump, including the health of the unit.
While not 100 percent conclusive, if a pump meets the published SO head, it confirms that the impeller diameter and speed are likely what you expected and as stated on the curve. Indirectly, it also tells you the direction of rotation is correct (or not, because a pump operating in the wrong direction will not come close). While it will not tell you the temperature of the pumped fluid, the information confirms the specific gravity (SG) if you know the fluid temperature (PSI x 2.31, divided by the head will yield the SG).
A satisfactory result from the SO head test also indicates the clearances in the pump are healthy, meaning they are at or near the manufacturer’s specification. What it will not confirm for you is if there is an issue in the system with air entrainment, submergence, net positive suction head available (NPSHa), or the fluid’s viscosity. You will need to operate farther out on the curve to investigate and collect the sustaining evidence for those issues.
If you are not confident in operating the pump at or near SO, please consult with the manufacturer, their representative or an expert. Not all pump types, systems or energy levels lend themselves to this specific test without negative consequence.
For more detailed information on this particular subject, please see my August 2019 Pumps & Systems column “Why Is Your Pump Operating Off the Curve?”
Minimum Flow
The point of allowable minimum flow will normally be defined on the curve. Do not operate the pump below this minimum flow rate for more than a few minutes. Some manufacturers refer to pump operation in the flow range just above the minimum flow point as MCSF, or minimum continuous stable flow. At flow rates below this stated point, the fluid will typically recirculate in the impeller eye and will be unstable. Note: in Image 1, we define minimum flow as near 1,450 gallons per minute (gpm).
The minimum flow rate for centrifugal pumps is based on two criteria: the first being mechanical limits of the machine due to the resultant and exponentially increasing radial forces that occur when operating at the low flows, mostly dependent on casing design and, to a smaller extent, on impeller vane overlap and specific speed (NS). The second reason is the thermal limit, whereas the pumped liquid will overheat due to recirculation and potentially flash. The manufacturer calculates both scenarios and then sets the boundaries. The higher of the two will become the pump’s minimum flow rate.
American Petroleum Institute (API) 610 states that MCSF will be no less than 60 percent as allowable value (but 70 percent is the preferred). Note: it is up to the manufacturer to design the pump to meet these criteria. American National Standards Institute (ANSI) B73.1-2011 states in paragraph 5.1.6 that, “Pumps shall be designed to operate continuously between 110 percent of BEP [best efficiency point] and the minimum flows.”
In the next issue, Part 2 will review navigating pump curves in relation to BEP, the point of runout, brake horsepower and more.
Reference
1. Pumps & Systems February 2018 article by Jim Swetye: “Reading a Centrifugal Pump Curve”
2. Pumps & Systems July 2017 article by Peter Gaydon: “The Basics of NPSH & Preferred Operating Region”
