

This column is a continuation of Part 1, which appeared in the January 2020 issue of Pumps & Systems. The first section explained that the manufacturer’s pump curve can be a useful tool to manage the reliability of the equipment and, subsequently, the system. But the pump curve can also be used in ways you may not have thought of before. Here is a continuation of that discussion.
Best Efficiency Point
The best efficiency point (BEP) is simply the design point for the pump. It is the hydraulic condition point of both head and flow rate where the pump is most efficient. In our example, the BEP for the pump at maximum impeller is approximately 3,450 gallons per minute (gpm) at 190 feet.
All commercial centrifugal pumps are essentially designed for one single point (BEP); any other operating points in the operating envelope are a commercial compromise. BEP is the point of highest efficiency. It is also the point of lowest radial forces, shaft deflection, noise and vibration. For some of us, it is also the operating point at or near shockless entry for the fluid entering the impeller eye.
Preferred vs. Allowable
The preferred operating region (POR) is normally defined as flow rates between 70 and 120 percent of the flow at BEP, and the wider allowable operating region (AOR) is usually defined by the manufacturer and will vary with pump type, casing design and other factors including the shaft. Note that for pumps with high specific speed impellers that the POR is normally reduced to 80 to 110 percent of BEP.
Runout or End of the Curve
The point of runout (RO) is also commonly referred to as the end of the curve (EOC), which is all the way at the right of the curve. In our example, flows approaching 4,500 gpm would be the RO point. This is the point of maximum flow for the curve and also the lowest head for that impeller diameter and speed. To attempt operating at higher flow rates would yield severe cavitation in the pump regardless of the net positive suction head (NPSH) margin. If the pump was capable of operating at higher flow rates, the manufacturer would surely publish that information.
People frequently ask me about the EOC operating region and the questions fall into two distinct camps. The first group is comprised of folks stating: Why not operate here? Followed by: Why won’t the pump operate past the EOC? The other group are people that for various reasons know or perceive the potential or imagined issues at the end of the curve and will not operate their pump anywhere near this area. In a way it is like dealing with fire. Get too close to the flames, and you will be burned or damaged. But, if you understand and carefully manage the fire as a useful tool—and if you maintain the correct distance—it will provide warmth and light.
If you don’t know the details of your system curve and how it changes with time and dynamic conditions, then you should not operate in this region at the EOC. In my pump classes, I refer to this region as one filled with dragons and wizards whose sole purpose is to make your life miserable. A simpler alternative explanation may be, it is a world without bacon.
Implied or Title Block Information
Information that is inferred, unless otherwise stated/published, is that the curve is based on hydraulic performance while pumping water at 60 F or 68 F. If the curve is based on a fluid different from water, and therefore a potentially different viscosity, the manufacturer must make that statement.
Viscosity-corrected curves will normally state that they are corrected. Additionally, the standard curve is based on a liquid with a specific gravity (SG) of 1.0. SGs other than 1.0 will result in different brake horsepower (BHP) requirements.
Note: There is potential for confusion on exactly which temperature is the standard water temperature and SG that pump manufacturers should use for the basis of published curves. This article will not expound further except to state that users should check with the manufacturer of the pump and/or see Chapter 4 of the “Cameron Hydraulic Data” book, 19th edition.
What may not be patently obvious is that the information required to calculate several additional parameters is also present, such as BHP specific speed (NS), suction specific speed (NSS) and suction energy (SE).
Brake Horsepower
Most published curves will offer the BHP information and my recommendation is to do the actual calculation anyway before anything is purchased to be safe. Again, note the BHP published on the curve will be based on water at 68 F unless noted.
Knowing the efficiency and, subsequently, the BHP, you can calculate your operating expenses and total cost of ownership. From that cost data you can determine if you need to operate differently, change the system design, or even perhaps replace the pump with another model or convert to variable speed. You can also use the BHP formula to solve for other parameters.
Normally: BHP = [(head) (flow rate) (specific gravity)] ÷ [(3,960) (efficiency)]
Alternately solved: flow rate = [(BHP) (3,960) (efficiency)] ÷ [(head) (SG)]
Equation 1
Mathematically, you can easily solve the equation for any one unknown. In Equation 1, I already know the BHP, but not the flow rate, so I set up the equation to solve for flow (where percent efficiency is expressed as a decimal).
Following this logic, you could also use this equation to solve for SG, head or efficiency.
Understanding Suction Specific Speed
The manufacturer may or may not offer this information somewhere in the title block, but to the experienced pump person the slope, size and shape of the curve will lend clues as to the NS range.
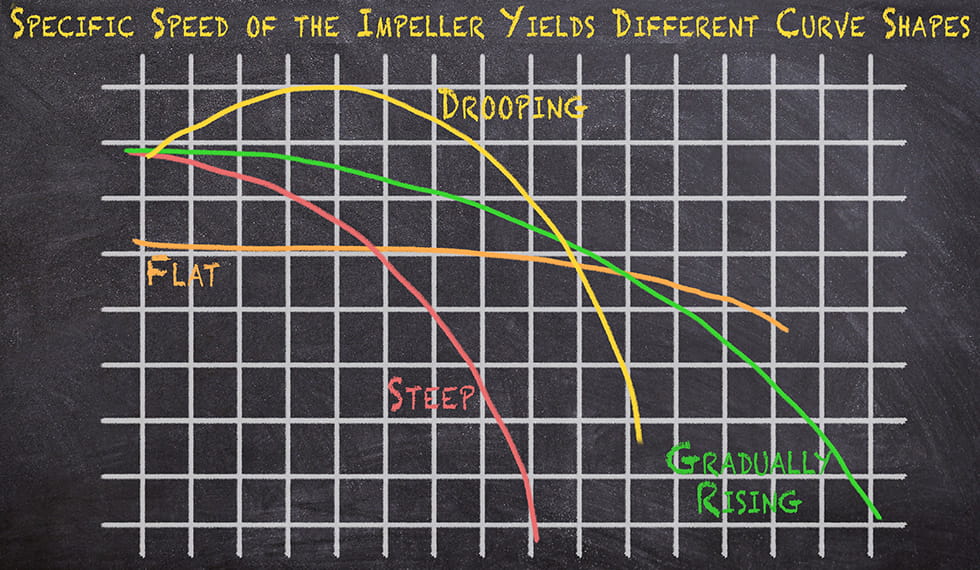 IMAGE 1: How curve shapes change as result of geometry and specific speed (Image courtesy of the author)
Please see Image 1 for a simple drawing on how curve shapes change as a result of their geometry and NS.
I will leave the details for a future article, but suffice to say that the number and shape/geometry of the impeller vanes will paint an illustrated story as to the NS. If you know the pump’s head and flow at BEP (and also the pump speed), then you can calculate the NS. Further, if you know the NS and the NPSH required (NPSHr), you can calculate the NSS. For dual suction impellers (two eyes), use half of the flow at BEP.
Why is any of this information important to you?
Well, depending on your system curve and where it intersects, the pump curve can make a big difference in the proper pump selection. You would not want to use a pump with a drooping curve if it was going to operate at lower flows, but if it was markedly higher in efficiency at high flows you would. If you had a system that used variable speed pumps, would you want a flat curve or a steep curve? For a boiler feed system in a base-loaded power plant, what curve shape would you want?
Pump Curve from the Manufacturer’s Perspective
As I mentioned earlier, the published pump curve is a promise, a sort of manufacturer guarantee that the pump will operate on that curve as indicated.
It does not mean the pump will operate where you wish and hope it to run, unless that point is exactly where the system curve intersects the pump curve (see my August 2019 article for more details).
For emphasis, I again point out that if the fluid has different properties not accounted for, or the system has issues with NPSH available (NPSHa), air entrainment, a miscalculated system curve or if the pump clearances are not set properly, the pump will operate somewhere else off the curve.
The pump curve is a statistical representation (albeit a conservative one) of empirical data collected and composed from the manufacturer’s test facility. The curve is a published proof of the manufacturer’s ability and it holds them accountable to the pump purchaser and end user.
Since most industrial pumps are constructed from castings, there are variables; and because no two castings are exactly alike when a curve is published, there are stated and acceptable industry tolerances.
Conclusion
I strongly recommend that you know where your pump is operating on its curve. If you don’t know where it is operating, then please try your best to find out.
If you have any management by objectives (MBO), quality assurance/quality control (QA/QC), Kaizen or Six Sigma training, you already know (and I am paraphrasing here) that if you don’t measure the pump performance then you can’t manage it. Left unmanaged, the pump will prematurely fail, and prior to that day it will needlessly cost you time and money.
Reference
1. Pumps & Systems February 2018 article by Jim Swetye: “Reading a Centrifugal Pump Curve”
2. Pumps & Systems July 2017 article by Peter Gaydon: “The Basics of NPSH & Preferred Operating Region”
