

The Jordan, Knauff & Company (JKC) Valve Stock Index was down 24.2 percent over the last 12 months, while the broader S&P 500 Index was up 4.5 percent. The JKC Pump Stock Index fell 17.9 percent for the same time period.1
The Institute for Supply Management’s Purchasing Managers’ Index (PMI) jumped to 52.6 percent in June, the highest level over the past year. New orders climbed to 56.4 percent from 31.8 percent the prior month. Order backlogs rebounded as well and, although the 45.3 percent reading is still in contraction, it had a big jump from 38.2 percent the prior month.
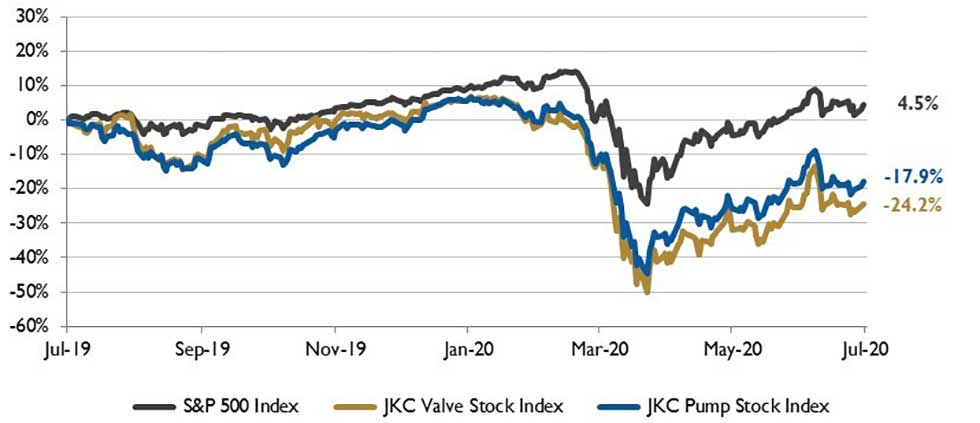 IMAGE 1: Stock Indices from July 1, 2019 to June 30, 2020. Local currency converted to USD using historical spot rates. The JKC Pump and Valve Stock Indices include a select list of publicly traded companies involved in the pump & valve industries, weighted by market capitalization. Source: Capital IQ and JKC research.
The U.S. Department of Labor reported that nonfarm payrolls rose 4.8 million in June. Over the past two months, payrolls in the U.S. have rebounded 7.5 million, as businesses that were shuttered due to the pandemic reopened. The labor market still has a long way to go to recoup the 22 million jobs that were lost in the U.S. in March and April. Increases were concentrated in industries that had borne the brunt of the layoffs. The U.S. unemployment rate fell to 11.1 percent in June from 13.3 percent in May. There are still nearly 18 million individuals in the U.S. classified as unemployed.
Horizontal wells have become the predominant way of drilling oil and natural gas wells in the U.S. In 2019, 75 percent of newly drilled wells were horizontal, averaging 18,000-foot wellbores compared with directional wells, which average 10,000 feet, and vertical wells, which average 4,500 feet. The number of U.S. oil and natural gas wells drilled each month per active rig has decreased since the peak of 3.6 wells per rig per month in 1986. In 2019, an average rig drilled 1.5 wells per month. By increasing the horizontal length of wells, producers have increased production despite using fewer rigs and drilling fewer wells.
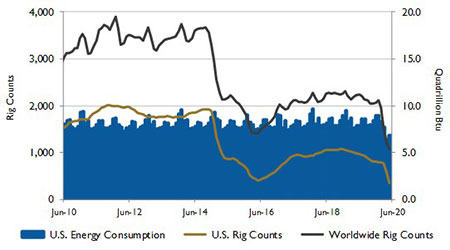 IMAGE 2: U.S. energy consumption and rig counts. Source: U.S. Energy Information Administration and Baker Hughes Inc.
This increase in efficiency pushed U.S. crude oil and natural gas production to new records in 2019 with 12.2 million barrels per day and 111.5 billion cubic feet per day, respectively. Using preliminary data for 2019, the average active rig count per month was 943, and the average count of new wells drilled per month was 1,400, according to Baker Hughes rig data and IHS Markit well data. The number of active rigs and the number of wells drilled were at the lower end of the range during the past 45 years, despite the record production.
The Dow Jones Industrial Average rose 1.7 percent, the S&P 500 Index gained 1.8 percent, and the NASDAQ Composite rose 6.0 percent for June, posting third consecutive monthly gains. Stocks rallied as the stimulus package and reopening boosted investors’ sentiments. However, the rally slowed due to resurgence in new coronavirus cases in several U.S. states. For the second quarter, the Dow gained 17.8 percent, its largest quarterly rally since the first quarter of 1987. The S&P 500 Index soared nearly 20 percent. The tech-laden NASDAQ gained 30.6 percent, its best quarterly surge since 1999.
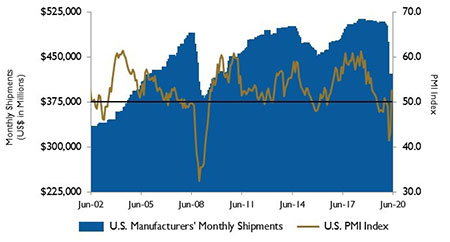 IMAGE 3: U.S. PMI and manufacturing shipments. Source: Institute for Supply Management Manufacturing Report on Business and U.S. Census Bureaue
Reference
1. The S&P Return figures are provided by Capital IQ.
These materials were prepared for informational purposes from sources that are believed to be reliable but which could change without notice. Jordan, Knauff & Company and Pumps & Systems shall not in any way be liable for claims relating to these materials and makes no warranties, express or implied, or representations as to their accuracy or completeness or for errors or omissions contained herein. This information is not intended to be construed as tax, legal or investment advice. These materials do not constitute an offer to buy or sell any financial security or participate in any investment offering or deployment of capital.
