07/22/2014
This is the first article in a four-part series. Four part 2, click here.
Second only to electric motors, centrifugal pumps are usually the simplest machines in a typical process plant. Pumps have fewer parts and are not nearly as complex as modern aircraft jet engines, for example. However, even a senior reliability professional may not understand why process pumps often experience more repeat failures and are often less reliable than a jet engine with more than 8,000 parts.
This four-part series will explain repeat failures. It uses a real-world field example involving boiler feed water pumps. It highlights many deviations from best practices that often become an accepted routine at many facilities. Deviations or oversights can range from seemingly insignificant to stunningly elusive. These can combine and often cause costly failures. Therefore, remedial steps should extend beyond pump restoration, and upgrading should be considered. Upgrade steps must be targeted to future failure risk reductions—a reliability engineer’s job.
A Defined Operating Range
Just because pumps can operate at low flow does not mean that doing so is beneficial. Compare this practice to running an automobile capable of going 20 miles per hour (mph) in sixth gear and 60 mph in first gear. If operated this way for too long, a high price will be paid. The same is true with pump hydraulics and with internal fluid recirculation issues. Fluid machinery has limits, which can be defined analytically or by factory testing. A simple sketch, originally hand drawn by Irving Taylor in 1977 (see Figure 1), will assist in visualizing pumps’ limits.1 A practical engineer, Taylor deserves credit because his approximations explain in one image what others have often attempted to convey with complex mathematical formulas.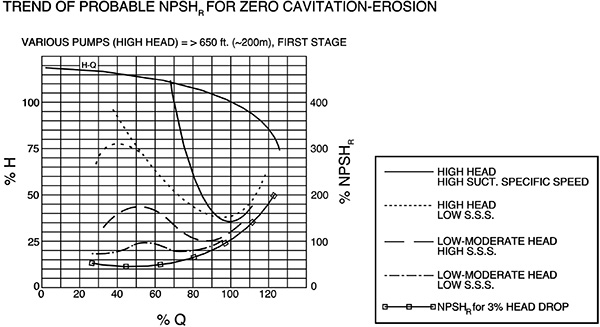 Figure 1. Pump manufacturers usually plot only the NPSHR trend associated with the lowermost curve. At that point, a head drop or pressure fluctuation of 3 percent exists at BEP flow.1
NPSH Is Not the Whole Story
Although more precise calculations are available, Taylor’s trend curves of probable net positive suction head required (NPSHR) for minimum recirculation and zero cavitation-erosion (see Figure 1) are sufficiently accurate for most fluids. The curves merit the attention of reliability professionals who want pumps to run within safe margins.2 However, the NPSHR actually needed to prevent damage to impellers and other pump components can be many times the amount published in the manufacturer’s literature. A factor of 2.5 or more is often recommended by field-wise engineers who reverse costly selection errors in services such as carbamate.2, 3 For reliable, long-term operation, the net positive suction head available (NPSHA) at the impeller inlet vane tips must exceed that of the true NPSHR at all times. Keeping the NPSHA-over-true-NPSHR ratio at more than 1 is very important for fluids that readily release a large volume of dissolved gas. Maintaining the ratio at more than 1 is less important for fluids that have little or no entrained gas. A pump manufacturer’s NPSHR plots are similar to Figure 1. They reflect the anticipated performance of a particular pump impeller and pertain only to that impeller’s geometry. The pump manufacturer reports or anticipates the NPSHR based on observing a 3 percent drop in discharge head. Two or three intersecting head (H)/flow (Q) points are plotted from tests, and the lines connecting these points are drawn in later. Issuing the resulting performance curve with the head achieved at zero flow is customary, although operating a pump at zero flow would destroy it. Head can be converted to pressure. Dividing the head by the specific gravity of the fluid being pumped allows an end user to calculate the differential pressure from the published and plotted head-versus-flow capability of an impeller. Taylor’s plot in Figure 1 places the Q = 100 percent intersect at an NPSHR = 100 percent of the manufacturer’s stated value. Unfortunately, whenever this 3 percent fluctuation occurs, some pump damage may already be in progress. For this reason, assuming a more likely and realistic NPSHR is often prudent. Alternatively and perhaps additionally, providing an NPSHA in excess of this assumed, more realistic NPSHR may be reasonable. Doing so builds a certain margin of safety into the pump and reduces the risk of frequent and sometimes catastrophic failure events—at a higher cost. Taylor acknowledged that his curves were not completely accurate and mentioned that a reasonable demarcation line between low and high suction specific speeds (Nss) probably existed somewhere between 8,000 and 12,000. The allowable Nss number is a function of the suction energy of a pump and may be as high as (or even higher than) 12,000.3, 4 Because the determination of the allowable Nss number seemed imprecise in the 1980s, several field surveys conducted before 1999 led to picking 8,500 or 9,000 as the highest “safe” number. From 1970 to 1999, impeller configurations with Nss numbers in excess of approximately 9,000 were not to be operated at flow rates much higher or lower than the best efficiency point (BEP). Operating certain process pumps at partial flow would reduce their life expectancy or their repair-free run time capability. PreDefining the Operating Range The constraints of parallel operation of pumps do not always receive proper emphasis. However, the process pump standard issued by the American Petroleum Institute (API-610) provides important guidelines. Unless pumps operated in parallel have identical performance curves, they will not share the load equally. Pumps operating in parallel should have relatively steep performance curves. Pumps with flat performance curves often have marginally higher efficiencies but will risk unequal load sharing. Operating flat-curve pumps in parallel might, in some instances, cause one pump to briefly run at zero flow. Pumps operated at zero flow will fail—some after one minute, others after one hour. While operating-range constraint questions generally apply to hydraulic parameters, pump hydraulics can, in turn, affect the life of mechanical components. Problems with short elbows near the suction nozzle of certain pumps can exist, and the resulting flow stratification and friction losses are sometimes overlooked. Other issues can be purely mechanical and are often related to the design or maintenance oversights. These are best addressed by enhanced work procedures and better quality control. Many good recommendations may be found in solidly experience-based references. Experience-based recommendations may not always please the occasional vendor (or purchaser) whose primary goal is low initial cost and who does not share a reliability focus. Some purchasers or owners will mention an isolated example in which a pump survived despite receiving no attention regarding reliability recommendations. These notions are similar to anecdotes about a driver whose life was saved because he did not wear a seat belt. Such arguments do not add value.
Click here to read part 2 of this article series.