The Internet of Things (IoT) is changing the way pumps and related systems are monitored and maintained. Wired and wireless sensors are being added to pumps, motors, pipelines and other process equipment. Data from these sensors is sent via wired or wireless plant networks, or the internet, to control and monitoring systems. This data is used to improve automated real-time control and help plant operators make decisions regarding operation and maintenance. It is also sent to data analysis software, which plant personnel can leverage to improve efficiency and diagnose equipment problems. The terms Internet of Things, big data and Industry 4.0 are now ubiquitous. Advances in sensors, networks and software are making it easier and cheaper to acquire, send, store and analyze data. No matter the terminology, the objective is the same: better insight sooner.
Sensors
Sensors are the starting point in the data collection process. They are attached to the “things” in the IoT—pumps, valves and other assets—and the cost of implementation and use is dropping rapidly, making it cheaper to acquire more data. Plant personnel were once limited to 4-20 milliamp (mA), Highway Addressable Remote Transducer (HART) or fieldbus to connect these sensors to control and monitoring systems and software. Today, however, they can use many different types of wired and wireless data connection methods, often employing multiple networks simultaneously in a single plant. These sensors and connections enable new data from new sources to be accumulated quickly and inexpensively. Data can be transmitted directly to control systems and process historians through plant networks. This data can be sent via the internet to databases in the cloud, where it can be accessed by any web-connected device. This means that the opportunities of IoT can be realized with or without the internet. The important part is collecting and analyzing the data, not the method of data transmission or the location of the data storage.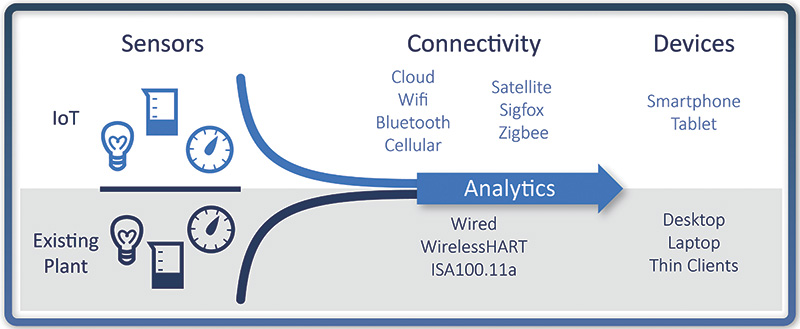 Figure 1. The Internet of Things involves collecting data from pumps and process systems, transmitting it through wired or wireless methods, analyzing it with software, and making it available to engineers via smartphones, tablets and computers (Courtesy of Seeq)
Instrumentation & IoT
Instrumentation and pump analysis software are allowing process plants to monitor pumps and detect problems long before a pump fails and shuts down a process. As recently as a few years ago, the expense of installing a dedicated online monitoring system kept these tools from being used on anything except the most critical pumps. A wired system requires supporting infrastructure such as cables, power supplies, conduit, termination boxes and safety measures when used in hazardous areas. But because of the relative ease of adding online pump condition monitoring using wireless sensor technology, a plant can now incorporate online monitoring for all of its important pumps (see Figure 2).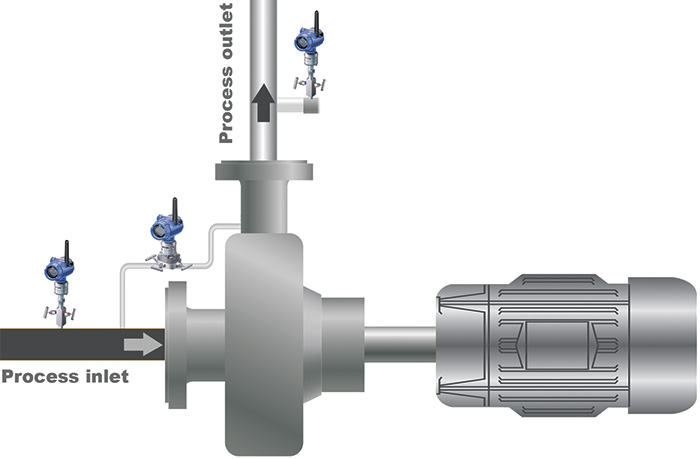 Figure 2. Wireless transmitters eliminate the need for cables, conduit, power supplies and safety devices. This makes it easier and less expensive to acquire data from pumping systems. (Courtesy of Emerson Process Management)
Data Delivers Value
Monitoring pumps and related equipment using IoT principles lowers costs by preventing unplanned downtime, which increases asset utilization and improves production planning. A facility can remotely monitor an asset without having to send an employee to each piece of equipment for data collection. In addition, only the right pumps and other assets are serviced based on predictive rather than planned or reactive maintenance. IoT can also enable collaboration to increase plant expertise through shared asset performance insights. Specialty equipment manufacturers, for example, analyze their remote equipment via the internet and the cloud, and specialty software vendors can analyze the efficiency of an entire plant or even an entire enterprise. For example, some companies connect monitoring data from their plants to the cloud because this is a low-cost and effective way to share data. In this case, companies want skilled personnel outside the plant to perform comparisons to drive improved outcomes (margins, yields, productivity, efficiency, costs, etc.). One of the best comparison sources is a company’s other facilities, along with industry-wide benchmarking information. Because cloud platforms provide the best price/performance for on-demand computing resources, companies can load data from multiple plants for analysis across lines, facilities and geographies to uncover best practices and insights. This is typically done with data for decision support, which includes both production data and contextual data to enable a holistic perspective on the plant’s performance. The examples above demonstrate improved operational equipment effectiveness. The critical aspect is that more data is just more data until it can be leveraged for insights and better decision-making.Simplifying Data Analysis
To deal with the challenges of the data deluge from IoT, information analysis software can work with data from batch or continuous process operations, which often come from different sources including control systems, historians, asset management systems and other plant data repositories. This software must enable rapid insights for the employees who know the process, assets and operations—and not require programming by computer experts or translation by data scientists.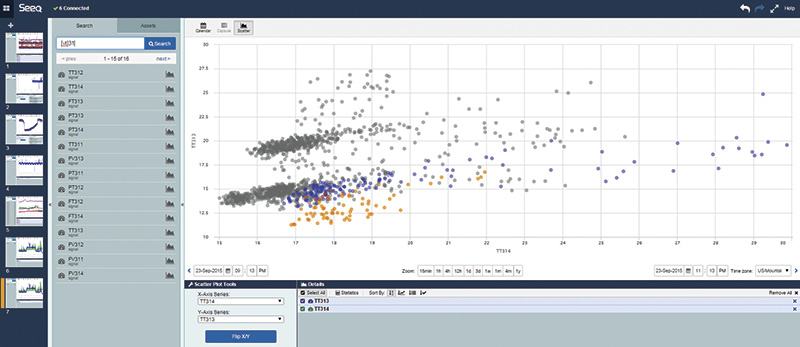 Figure 3. This scatter chart can be quickly and easily created by process plant personnel for analysis of data and subsequent improvement of operations (Courtesy of Seeq)
- Accessibility: This requires an application approach that allows engineers and analysts to easily use the software in their investigation to improve outcomes. The analysis tools must fit the person who has the expertise and perspective on the plant.
- The contextualization of data: Sensor data is organized by the batch it is associated with, or by a train or unit in a continuous process. Manufacturing and production data can come from many sources including sensors, controllers, human machine interfaces (HMIs), historians, asset management systems and production planning systems. The data analysis software solution must be able to mix and match data from all of these and other sources in one powerful but easy-to-use visualization environment to enable quick analysis.
- Collaboration support: This allows for shared discovery and discussion among team members, both within a group and across a facility. This requires access to the data analysis software from any browser running on any platform including PCs, tablets and smartphones.