
My recent series titled “Case Study: Troubleshooting Seal Problems in Cooling Water Pumps,” published in Pumps & Systems (December 2016, and January and February 2017, find them here), described using automated pump field performance data acquisition systems to assess pump components’ reliability (in seals and bearings) via vibrations monitoring and through online efficiency measurements for energy optimization. The series generated significant input and questions from readers about the system’s details. This column describes the process of the automated data acquisition system dubbed “PREMS-2A” (Pumps Reliability and Efficiency/Energy Monitoring System, rev. 2A). It is important to understand pump efficiency. By integrating efficiency data into the repair and upgrade scheduling logistics process, users can generate significant energy savings. For a large pump, even a few points of efficiency degradation can translate to tens of thousands of dollars wasted if proper periodic adjustments are not implemented. Consider, for example, a typical 1,500-horsepower (hp) cooling water pump at a power plant operating non-stop at $0.10 per kilowatt-hour (kWh) cost. This translates to (1,500 x 0.746) x 24 x 365 x 0.1 = $980,244 per year, and each percent of efficiency degradation would mean $98,024 a year. After approximately 10 years in service, it is not uncommon for pumps to easily drop 5 to 10 percent in efficiency due to wear and operating away from the best efficiency point (BEP) because of process changes. Trending and monitoring pump efficiency helps users decide when to schedule efficiency repair upgrades and evaluate the return on investment against the proposed cost of such repairs/upgrades. A typical PREMS system consists of instrumentation (pressure transducers, electric current coil transformer [CT]); ultrasonic flow meter (or alternative 4-20 mA inputs from the existing meter); vibration accelerometers (with full Fast Fourier Transform [FFT] capability) and thermocouples; and data acquisition chassis hardware. The PREMS system also includes a PC to receive data locally or transmit it via modem gateway for a remote display. The display shows the actual pump performance curves (head, power, efficiency versus flow) displayed in real time and plotted against the expected performance, based on original equipment manufacturer (OEM) figures. The difference between actual and expected efficiencies is calculated and displayed numerically and trended as “dollars being burned.” A typical field setup (see Image 1) takes a few hours to install and activate to watch the data streaming live.
.jpg) Image 1. A typical field setup of the PREMS performance data acquisition system (Image and graphics courtesy of the author)
Image 1. A typical field setup of the PREMS performance data acquisition system (Image and graphics courtesy of the author)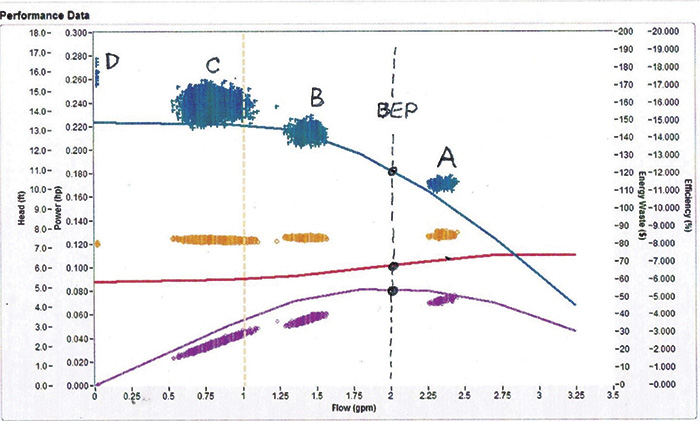 Figure 1. Pump No. 2 operating by itself: actual performance data versus expected OEM curves
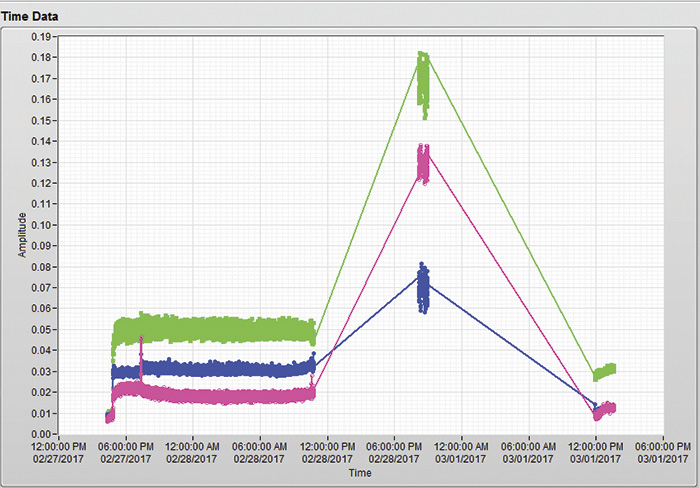 Figure 2. This shows vibration traces over time. Note the “event” spike of vibrations.
 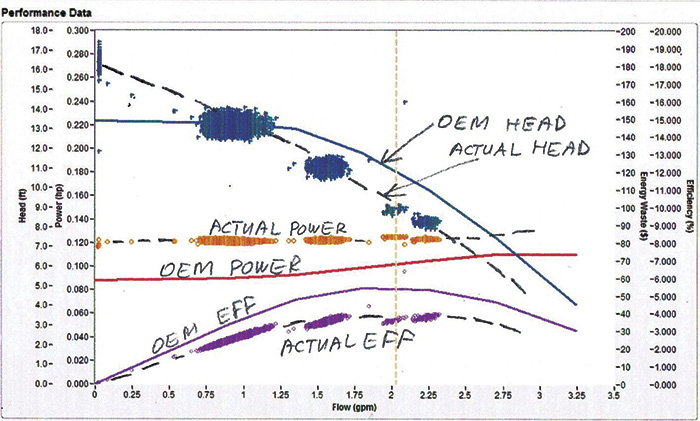 Figure 3. Pump No. 1 operating by itself: actual performance data versus expected OEM curves
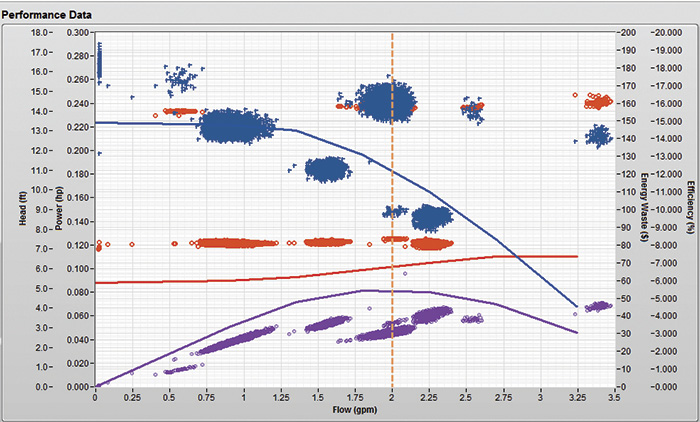 Figure 4. The parting quiz: Can you tell what this graphic illustrates?
References
PREMS-2A system: Reliability and Efficiency Live Assessment System:
http://www.pumpingmachinery.com/consulting/PREMS-2A/prems-2a.htm
