Pump System Improvement
Engineered Software Inc.

I am often asked why a system is not operating properly. In many cases, I have limited operational experience with the specific user’s fluid piping system. But by breaking down the system into the pump, process and control elements, one can quickly understand how it operates.

This month’s column will look at a crude oil desalination system used to remove water and various minerals. Figure 1 provides a piping schematic of the system.

This system mixes water with the crude to remove contaminants before sending to the flash and separation towers. The crude is preheated and water extracted from the second stage is added to create a mixture that is run through a mixing device before entering the first desalting unit. The first desalter separates the oil from the brine and sends the brine effluent for treatment and the cleaned crude to the second stage, where the process is repeated.

Piping flowchart
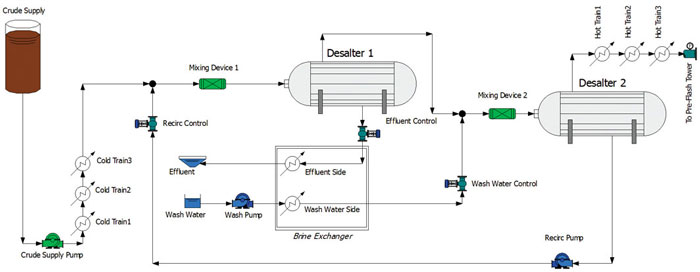
Figure 1. Piping schematic of a crude oil desalination system (Graphics courtesy of the author)

After a system is placed in operation, things change—equipment wears, deposits build, replacements and modifications are made. Process or product requirements and raw material properties begin to vary. The initial system design no longer matches what the instruments are reporting. The model becomes a great diagnostic tool. If readings do not match the validated model, something has changed—and it is not the laws of physics upon which the model is based.

When comparing the piping system model to the actual system operation, if the difference between a pump’s suction and discharge pressures do not match the model, then further investigation into the pump is warranted.

I ask first if the manufacturer’s supplied pump performance curve was used in building the model. Surprisingly, the answer is usually no. Having correct pump curves is essential to troubleshooting piping systems without costly trial-and-error methods. The pump curve helps determine if the problem is between the flanges or outside the flanges.

If pressure drop across a valve, heat exchanger or other device—even a specific length of pipe—does not match the model’s results, then that can point to a root cause. If the pressure is too high in the process elements, the flow path may be blocked with debris or buildup.

A pressure drop too low should suggest investigating whether there has been erosion, failure in a positioning device or control system error, or a leak somewhere between the sensors. Coupling the comparison of model and actual flow rates with pressure drops is even more revealing.

Examining both flow rate and pressure drop differences yields more information to assist in system troubleshooting.

Consulting the model as a diagnostic tool can help identify root cause more rapidly by pointing in the right direction.

As designed, the three pumps in Figure 1 are running close to their respective best efficiency points (BEPs), and valves are all within their control ranges. The pumps and valves were instrumented, but the individual process devices were not. The water-to-crude volumetric ratio for each unit was designed to be around 5.2 percent. See Table 1 for initial system design conditions, with instrumentation data shown in red.

System elements operating as designed Table
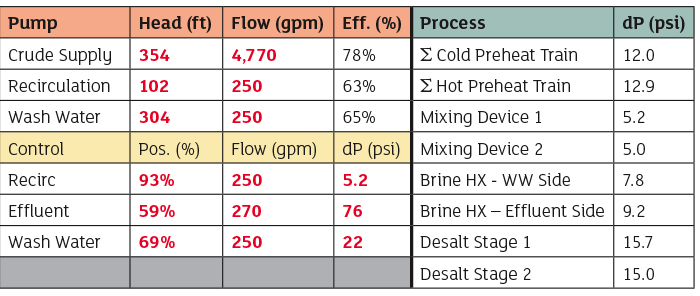
Table 1. System elements operating as designed

After some time, an operator noted noise coming from the effluent control valve. The operator noted that the recirculation (recirc) valve was 100 percent open and no longer controlling flow.

Sampling the mixes going into the desalters showed the water-to-crude volumetric ratio going in to Desalter 1 had dropped to 4.8 percent and going in to Desalter 2 was now 5.6 percent. The operator took measurements from the instrumented devices. The readings are shown in Table 2 with design values in brackets.

Table pump and controlTable 2. System measurements from instrumented devices

Having a system model that provides the expected parameters and pump curves for each pump in the system can be of great benefit. One possible cause for the reduced flow in the recirc line would be pump damage or impeller corrosion, which would result in the pump operating off its curve. Fortunately, the pump curve was available. A quick review shows that it is still on the curve and operating properly.

The noise from the effluent control valve indicates there may be cavitation or choked flow in the valve; the as-designed model indicates choked conditions would be flow over 271 gallons per minute (gpm) or pressure drop over 76 pounds per square inch (psi). Since our set point is 270 we are close, but still OK, so the noise is likely due to an increased pressure drop across the valve.

Checking the gauge shows the pressure drop across the valve is 82 psi, and the upstream pressure is higher than originally modeled.

The wash water control valve shows it is operating properly, but opens more than the model would expect. It also shows the downstream pressure from that is also higher than originally modeled. The pressure is higher than expected upstream of Mixing Device 2, but lower downstream of Desalter 2. Now we can zero in on a probable cause—plugging in Mixing Device 2, which turned out to be the case.

This scenario highlights another way system analysis is critical in operation and troubleshooting. The two control valves exhibiting the errant behavior were located away from the actual problem. If this involved a component view, there may have been more investigation into the valves or even the pump.

With a validated system model, the actual readings from the system can be compared to the expected values in the model and can be a valuable troubleshooting tool, especially in areas or parts of a system where instrumentation is not installed.

When taking ownership for operating a system, make sure to get copies of the system analyses, including all the pump curves, and keep them up to date. When something goes wrong, it will be accessible with a touch of a button.

To read more Pump System Improvement columns, click here.

Issue