
Pumping Prescriptions
Pumping Machinery LLC
12/29/2016
First in a Series
Editor’s Note: Barry T. Brown of Spurlock Station, Unit 2, East Kentucky Power Cooperative contributed to this column.
Three double-suction horizontal split-case pumps installed around 2009 have had mechanical seal issues since installation. Of the four power generation units at East Kentucky Power, Unit 2 was the only one demonstrating these problems.
The unusual installation configuration (vertical position) made plant personnel wonder if such an orientation might be contributing to the problems.
If so, significant modifications would be required to convert the system to a more typical (horizontal) position.
The pumps (2A, 2B and 2C) handle clean cooling water at 100 F, with suction pressure at approximately 20 pounds per square inch gauge (psig) and discharge at 70 psig. The water is then pumped into an 18-inch discharge header. The pumps are driven by 200-horsepower (hp) electric motors at 1,778 revolutions per minute (rpm) with no variable frequency drive (VFD) control.
Plant personnel planned to investigate the following items to determine possible causes of the seal problems:
- Pump operation, including actual operating flow range versus best efficiency point (BEP) according to the original equipment manufacturer (OEM) curve
- Possible improper installation (misalignments, piping loads, etc.)
- Seal flush/vent issues and similar design-related aspects
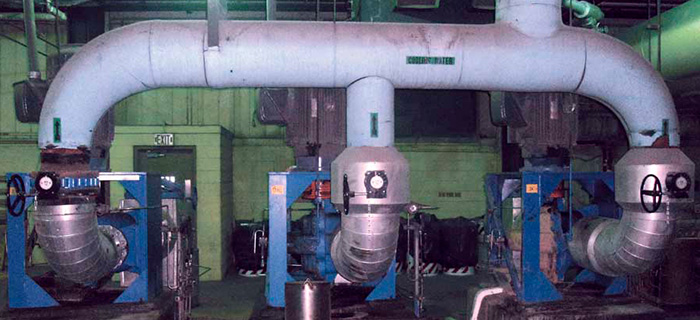
.jpg) Images 1. Suction and discharge piping (Images courtesy of the author)
Images 1. Suction and discharge piping (Images courtesy of the author).jpg) Images 2. Suction and discharge piping (Images courtesy of the author)
Images 2. Suction and discharge piping (Images courtesy of the author)Pump Operation
A pump reliability and efficiency measurement system (PREMS-2A) data acquisition system was installed to troubleshoot this case and to track parameters related to both pump reliability (vibrations, temperatures) and performance (head-capacity, power and efficiency). The system acquired data every 2 seconds and displayed it on the computer screen every 10 seconds. Both remote (cell tower gateway) and local access were verified to successfully transmit data. The system was then set to a local mode (PC connected directly to the PREMS-2A chassis) and collected data continually for 16 hours for Pump 2A, 36 hours for Pump 2B and 106 hours for Pump 2C. Collecting this data allowed plant personnel to determine two objectives:- actual operating flow range
- any possible transient events (vibrations, including spectral fast Fourier transform [FFT] data logging)
 Images 3. Location of the ultrasonic flow meters
.jpg) Images 4. Location of the ultrasonic flow meters
Images 4. Location of the ultrasonic flow metersPressures
Transducers were then connected to quarter-inch tabs teed-off the existing pressure gauge connections (see Images 1 and 2).Flow
The team tried three ultrasonic flow meters:- Dynasonic D902 (Doppler type)
- Dynasonic DXNP-RW (combination type, with both Doppler and transient time probes)
- GE 878 (transient time)
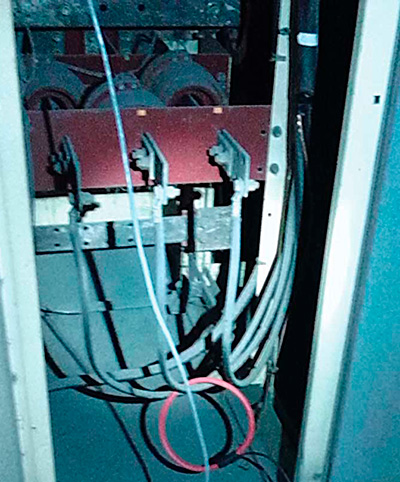 Image 5. Current transformer coil (CT) was installed over one of the motor phases.
Amps & Power
A current transformer (CT) coil was installed at the motor leads, approximately 100 feet away from the pumps/motors (see Image 5). The PREMS-2A system calculates the power via one of the two methods (rated amps/power versus actual reading) or a direct method by multiplying the amps by volts, power factor, motor efficiency and a three-phase constant. It calculates efficiency using the PREMS-2A internal program (the direct amps method is typically simpler and was selected in this case), which continually displayed the data on the computer screen in the form of actual performance (H-Q, power and efficiency curves versus OEM expected results). Because of earlier issues with the Dynasonic instrument flow measurements, the team was unable to acquire the efficiency curve in time. By the time the GE 878 was applied successfully, the PREMS-2A was already removed, and the flow data had to be back-fed into it after the test.Vibrations & Temperatures
The vibration and temperature probes have magnetic bases, and their installation was simple and quick. Part 2 of this series will discuss data trends and analysis from this case study. Read it here. References- L. Nelik, Pumps & Systems, July, August, September, October 2015, “Efficiency Monitoring Saves Plants Millions” – in four parts
- PREMS-2A Pumps On-Line Efficiency and Reliability Monitoring: http://www.pumpingmachinery.com/pump_school/PVA/pva.htm (model #11)
- L. Nelik, “Analysis of the Thermal Behavior in the Sealing Cavity of an Overhung API Process Pump,” Proceedings of 8th International Pump Symposium, Texas A&M, March 3-5, 1991
See other Pumping Prescriptions articles here.
