Pump manufacturers should prepare for the changes that the impending regulations will bring, including possible design improvements.

Second of three parts. Part 1 was featured in the January 2014 issue of Pumps & Systems. View part 3 here.

This is the second part of a three-part series that discusses the upcoming U.S. Department of Energy (DOE) pump efficiency regulations and how the Hydraulic Institute (HI) is working with HI members, the DOE and other groups to reduce the burden on U.S. pump manufacturers, while supporting DOE efforts to achieve energy savings and efficiency improvements in the marketplace.

During its February 2013 annual meeting, HI members formulated a consensus on the more than 130 technical and market-based questions raised by the DOE that was presented at the framework hearing in Washington a week later. A 465-page transcript of the proceedings, along with HI discussions, is available on the DOE rulemaking website. HI’s written response is also available at www.Pumps.org/DOERulemaking.

More recently the DOE launched a parallel “negotiated rulemaking” process under the Appliance Standards Rulemaking Advisory Committee (ASRAC), which first met in Washington, D.C., on Dec. 18 – 19, 2013. A group of HI members has been appointed to the ASRAC working group on pumps, along with other members who represent energy efficiency advocates, electric power utilities, DOE staff and an end user. A schedule of public meetings was established that run through July 2014. HI will provide updates to its members, and also post progress reports on www.Pumps.org/DOERulemaking as new information becomes available.

MEI Basis

To reduce the burden on pump manufacturers while addressing pump efficiency, HI recommended that the DOE adopt a Minimum Efficiency Index (MEI) that is central to the European Union (EU) 547/2012 Standard as proposed in EU Lot 11.

HI advocated to the DOE that “the MEI equation should be used with the EU coefficients for a, b, c, d, and e as set forth in the Department’s framework document (Appendix C, p. 110, p. 116, et al.), remaining consistent with the EU Directive, but with updating the EU’s coefficient, C and the Department’s coefficient, f (equivalent to the C value in EU regulations) to reflect the proper efficiency cutoff values that result in specified minimum efficiency thresholds, based on HI’s more current data.”

In a survey conducted by HI with 17 member companies soliciting data on 2,124 pump models, the resulting database is roughly statistically equal to the size of the EU database used to create the EU Lot 11 Standard (2,390 pumps) (Europump study). The European database served as the basis for the equation that is the backbone of the MEI Standard. The equation describes a three-dimensional (3-D) quadratic surface, representing the minimum efficiency threshold of pumps that can be sold in the EU market. Minimum efficiency thresholds (ηBot) are established using the same equation as developed for the EU pump efficiency regulation:

ηBot = -11.48x2 – 0.85y2 – 0.38xy + 88.59x + 13.46y – C

3-D plot of the MEI equation
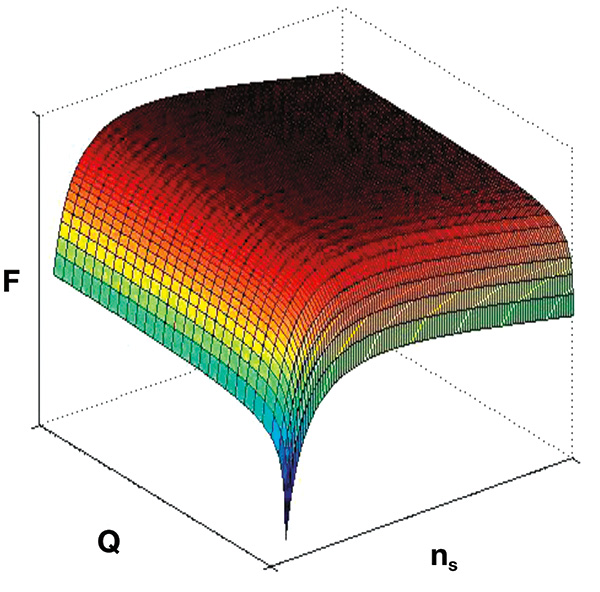
Figure 1. 3-D plot of the MEI equation

The plot (see Figure 1) can be moved up and down vertically along the efficiency (η) axis by changing the constant, C, at the end of the equation. This C factor allows the equation to be fitted to different pump types and different operating speeds.

In a May letter to the DOE, HI urged that the C coefficient alone be used to modify the efficiency cutoff level (thresholds) for each MEI level, as was done in the EU. Based on its analysis, HI recognized that better data fits could be obtained through changing coefficients a through e in the 3-D quadratic polynomial equation or that completely different forms of equation may provide more precise data fits. HI does not, however, believe that the complexity of these options is warranted and submits that it will not yield significant improvement in the ability of the equation to represent a cut-off level for pump efficiency.

Further, doing so causes the following:

  • Places significantly greater regulatory burdens on U.S. pump manufacturers
  • Restricts export opportunities to markets and countries that adopt the EU standard and/or regulation
  • Creates increased compliance issues for imported pump products that are subject to different efficiency metrics while only serving to disadvantage U.S. pump manufacturers and their global competitive position

The purpose of this equation is not to predict precisely the efficiency of pumps in a certain product class. The equation was created as a tool to allow regulators to remove the bottom x percent of pumps from the marketplace. These pumps, because of their low efficiency, would require the highest level of energy input per volume pumped in that equipment class. Removing them from the market place would reduce the amount of power being consumed by the remaining population of pumps being sold into the marketplace.

Because of a limited data set for some pump types, a significant dead band exists, such that when changing the C coefficient, no subsequent change in the percentage of pump failures is observed. This is a function of the small number of models available in that particular pump type. If more models for that pump class were included, should they exist in the marketplace, it would again change the equation that fits that data. The problem with trying to develop a precise data fit to some of these pump types is that the limited number of models available, along with the spread of the data, lead to a level of uncertainty, making a precise data fit unlikely. Further complicating the equation will not improve this precision and will make uniform implementation of the regulation more difficult.

The letter further points out that the Europump study was based on a population of more than 2,300 pumps, while the HI survey of U.S. pump manufacturers was based on a population of 2,124 pumps, using the same scope of equipment specified in the EU directive. The DOE framework document, however, states that 27,000 pump types were analyzed. HI questioned the validity and source of this number because it did not appear to match the proposed scope of the pump efficiency rulemaking. While the HI survey did not absolutely capture the complete marketplace, HI is confident that the market is not 13 times larger as noted in the DOE’s reference to 27,000 pump types. This conclusion is strengthened because most of the major corporations identified in the DOE framework document are represented in the HI survey.

The HI data analysis also sought to ascertain whether U.S. pump industry failure rates match those of the EU. Using EU C factors to determine the failure rates within the HI survey universe, aggregate failure rates were close to the 10-percent and 40-percent failure rates, as predicted by the equation for C values of 0.1 and 0.4, respectively. The HI survey of 17 manufacturers, however, yielded different results in some of the pump categories. The failure rate for each pump category is shown in Table 1. HI believes that this anomaly resulted because failure rates for all the categories combined in this initial analysis, which was based on averaging, would be different when each pump type was compared individually within its cohort group.

North American pump MEI failure rates using European C values
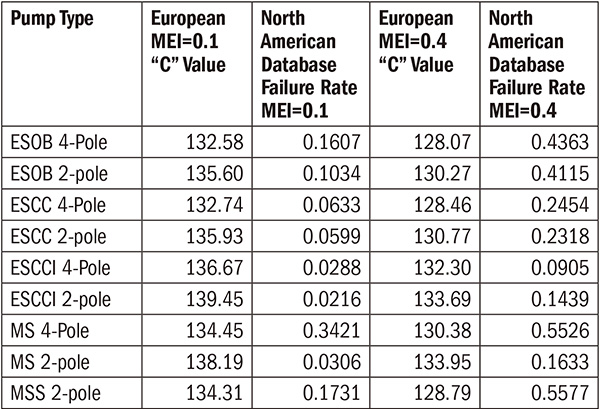
Table 1. North American pump MEI failure rates using European C values

To evaluate the same pumps again, on the basis of varying only the C factors in the equation, HI was able to obtain the respective 10-percent and 40-percent failure rates for the U.S. pump data. The C factors were changed to obtain the anticipated failure rates, and the data was then consistent with 10-percent and 40-percent failure rates (see Table 2).

North American pump MEI failure rates using modified “C” values
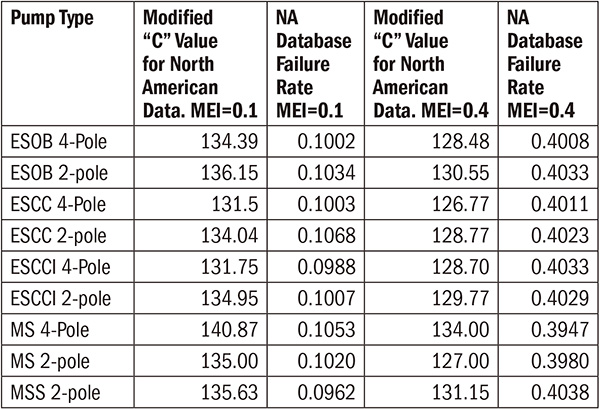
Table 2. North American pump MEI failure rates using modified “C” values

Based on the differences in failure rates and C factors, HI determined how well the MEI equation used in the EU standard applies to the U.S. data set. Each set was plotted and visually compared to the shape of the MEI equation’s 3-D surface plot.

A quantitative analysis of the goodness of the fit for the equation is difficult because the equation is not meant to represent a fit to the data but instead a threshold value above which x percent of the data should be. Even plotting a MEI = 0.5 with 50 percent of the data points above and 50 percent of the points falling below the surface does not necessarily represent the best fit of the equation to the data because of the non-uniform distribution of the data set.
While other equations may fit the data better, they would be complicated to modify for the multiple pump categories and the two- and four-pole operating speeds. The variation of the constant C in the MEI 3-D quadratic equation represents a good data fit and a simple way to adapt the equation for different categories and operating speeds.

The modified C values to fit the North American data represent different efficiency thresholds that the U.S. pumps would need to achieve when compared to their EU counterparts. The percent efficiency difference for each pump type is shown in the Table 3. The values in parenthesis indicate instances in which the EU efficiency was greater than the North American efficiency.

Difference in MEI threshold efficiencies using modified C values in North America versus the EU C valuesTable 3. Difference in MEI threshold efficiencies using modified C values in North America versus the EU C values

Based on HI analysis, the MEI equation is a good fit for both U.S. and EU data. The equation only requires the adjustment of the C coefficient to correctly represent the proper threshold efficiencies for the various pump types and appears to be only slightly different for the EU and North American data sets. This approach achieves global harmonization of pump efficiency standards and provides a method that appears to be both technologically feasible and economically justified.

Significantly, HI believes that the data set collected by the DOE and its consultants is unrealistic and includes many pump product classifications that are currently regulated by other entities. It is HI’s view that forcing certain pumps—such as chemical processing, oil, gas and fire pumps—to meet efficiency DOE regulations would compromise their mechanical integrity, posing a danger to public health and safety. Well-established standards for such pumps—including American National Standards Institute (ANSI) B.73, American Petroleum Institute (API) 610 and National Fire Protection Association (NFPA) 20—address the unique characteristics and service of these pumps, which are not associated with pumping clean water (in the case of ANSI B.73 and API 610) or focused on the reliability needed for fire protection (NFPA 20)—in which case, such pumps are rarely used and only used in the event of a fire. These pumps will not be used for clean water service for many reasons, not the least of which is the higher cost associated with their unique designs.

Click here to view part 3 of this series.