The Jordan, Knauff & Company (JKC) Valve Stock Index was down 20.9 percent over the last 12 months, while the broader S&P 500 Index was up 1.3 percent. The JKC Pump Stock Index also decreased 11.8 percent for the same time period.

Stock indices from Dec. 1, 2014, to Nov. 30, 2015
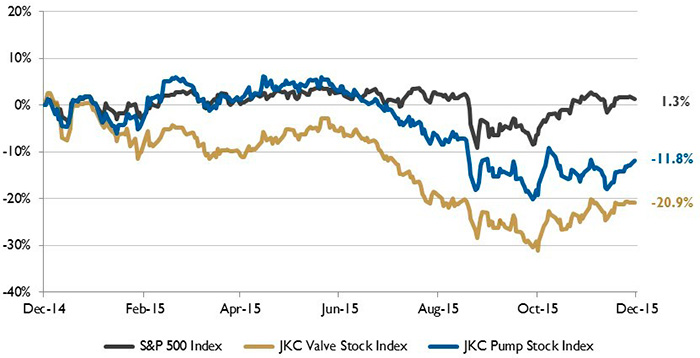
Figure 1. Stock indices from Dec. 1, 2014, to Nov. 30, 2015 Source: Capital IQ and JKC research. Local currency converted to USD using historical spot rates. The JKC Pump and Valve Stock Indices include a select list of publicly traded companies involved in the pump and valve industries weighted by market capitalization.

The Institute for Supply Management’s Purchasing Managers’ Index (PMI) fell to 48.6 percent for November, indicating contraction in manufacturing for the first time since November 2012. New orders and production also fell into contraction territory, declining 4.0 percent to 48.9 percent and 3.7 percent to 49.2 percent, respectively. Ten of 18 sectors reported contraction with lower new orders, production and raw materials inventories. Only five industries reported a gain in production, including electrical equipment, appliances, furniture, and food and beverages.

The Bureau of Labor Statistics reported that nonfarm employment increased by 211,000 in November. Over the past three months, U.S. job gains averaged 218,000 positions. Employment in construction rose by 46,000 in November. Retail jobs increased by 31,000, and restaurants added 32,000 jobs.

Employment in other major industries, including wholesale trade, transportation and warehousing, financial activities and government, saw little change over the month.

U.S. energy consumption and rig counts
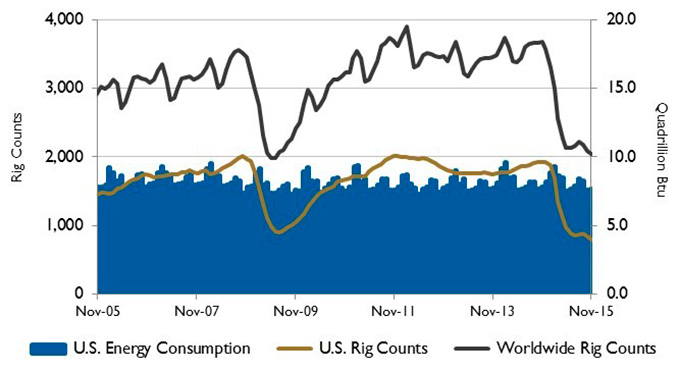
Figure 2. U.S. energy consumption and rig counts Source: U.S. Energy Information Administration and Baker Hughes Inc.

Manufacturing employment was flat for the month as a strong dollar, lower commodity prices and weak global activity have reduced demand for exports. The U.S. trade deficit rose 3.4 percent in October as exports dropped 1.4 percent to $184.1 billion, the lowest level since October 2012.

Crude oil imports from Canada have been increasing over the past decade, even though overall U.S. oil imports have been declining. According to the U.S. Energy Information Administration (EIA), as of August, Canada provided 45 percent of all crude oil imports to the U.S. This is almost three times as much as all Persian Gulf countries combined, which supplied 16 percent of U.S. imports in 2015. The U.S. has been the primary destination for Canada’s exports since the early 2000s.

U.S. PMI and manufacturing shipments
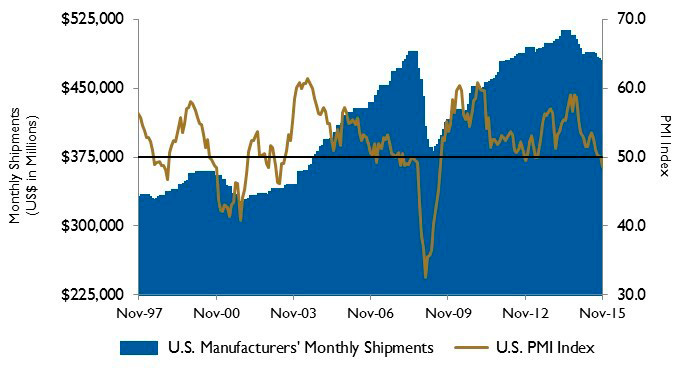
Figure 3. U.S. PMI and manufacturing shipments Source: Institute for Supply Management Manufacturing Report on Business® and U.S. Census Bureau

The EIA reported that U.S. crude oil and lease condensate proved reserves increased by 9 percent in 2014 to 39.9 billion barrels, the highest level since 1972. Texas, representing 60 percent of the country’s total net increase, had the largest increase, followed by North Dakota. Proved reserves, which are volumes of oil that are reasonably recoverable under existing conditions, fluctuate based on changes in commodity prices and extraction costs. Because of ongoing lower crude oil prices, proved reserves are anticipated to be lower next year.

On Wall Street, the Dow Jones Industrial Average was up 0.3 percent, the S&P 500 Index increased 0.1 percent, and the NASDAQ Composite rose 1.1 percent for the month of November. Financial and energy stocks had the largest gains during the month, while utility stocks were the largest decliners.

Reference
1. The S&P Return figures are provided by Capital IQ.

These materials were prepared for informational purposes from sources that are believed to be reliable but which could change without notice. Jordan, Knauff & Company and Pumps & Systems shall not in any way be liable for claims relating to these materials and makes no warranties, express or implied, or representations as to their accuracy or completeness or for errors or omissions contained herein. This information is not intended to be construed as tax, legal or investment advice. These materials do not constitute an offer to buy or sell any financial security or participate in any investment offering or deployment of capital.