By providing real-time consumption information to customers, utilities can realize significant water savings.
FATHOM
05/23/2017
Water utilities are facing the threat of aging infrastructure, increasing costs and decreasing revenue. Factor in the uncertainty associated with increased volatility in the hydrologic cycle and it can be easy to understand the extreme financial and operational pressures these utilities encounter. Fortunately for today’s utilities, tools including data-driven systems and processes that drive efficiency into utility operations are generating opportunities to rein in these problems, providing the platform to achieve financial and operational sustainability.
Demand-Side Management
One of the key benefits of advances in data-driven systems for utilities is the availability of near-real time information.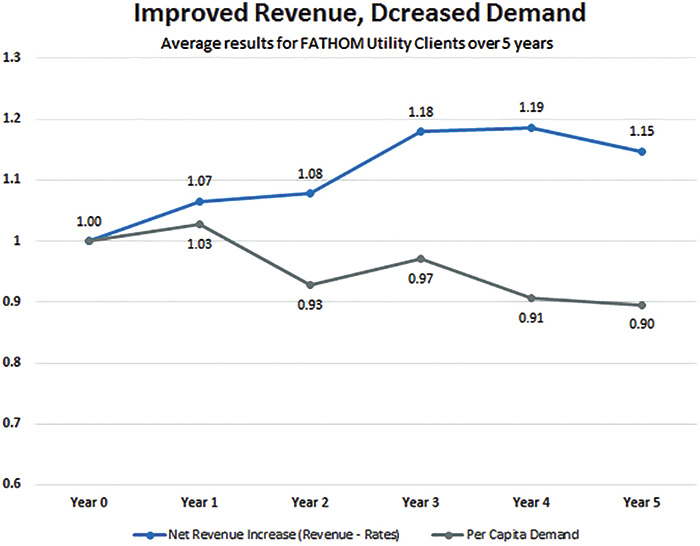 Figure 1. Revenue increases and per capita demand reductions after adopting data-driven analytics platforms for DSM (Graphics courtesy of FATHOM)
Reducing Costs
As a first order approximation, the power required to supply water is a function of flow, pressure, the fluid’s specific gravity, and pump and motor efficiency. From a utility perspective, while there may be some control over the pump and motor efficiency by designing and operating systems on the pump curve, the impacts of reducing pressure or flow can be more impactful. By reducing demand, utilities can realize three immediate benefits:- Operating pressure can be reduced. A 10 percent reduction in flow reduces the pressure requirements by 19 percent. Reducing the overall demand reduces the pressure necessary to move water through the distribution system. And as pressure is proportional to the square of the flow (velocity), the effects are compounded for pressure.
- Line losses, typically directly proportional to velocity (flow), are decreased, further reducing the pressure requirements.
- The physical strain on aging infrastructure can be reduced.
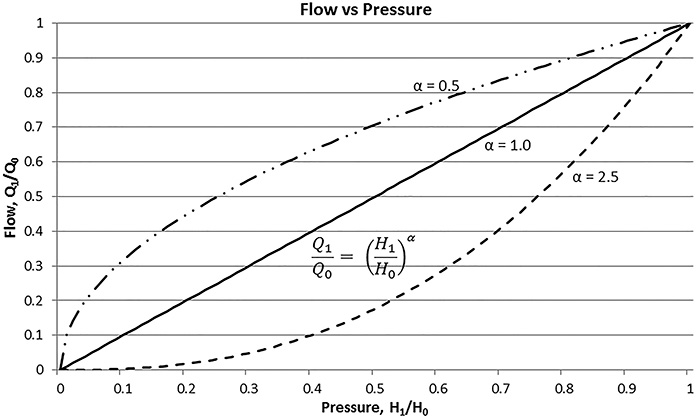 Figure 2. Leak flow reduction via pressure management3
Extending Infrastructure
An oft-overlooked benefit of employing these management systems is “found capacity.” As a result of data-driven DSM activities, capacity liberated from existing systems. Because water infrastructure typically scales linearly with population,1 demand reductions can be translated into direct availability for new consumers and into significant deferral—or even elimination—of near- and long-term capital projects. As an example, a typical capacity calculation for utility infrastructure includes average daily flow, a peaking factor assessment, an allowance for leakage and an allowance for fire flow. By reducing overall consumption, both the peak hour flow and maximum daily flow are reduced by an equivalent amount, allowing infrastructure elements like pump stations to serve more homes. Since water storage requirements are often based on the “average day maximum month” flow plus an allowance for fire flow, a reduction in demand translates to a reduction in the storage requirements for the existing population, and by extension creates storage capacity in the existing infrastructure for future use.Taking the Pressure Off
Data-driven DSM can result in significant benefits for aging infrastructure through leak and burst reduction. Pressure management is an established leak control methodology for many water systems. Understanding the real-time demand in utilities gives operations staff the ability to develop pressure management protocols that reduce leaks and burst without impacting quality of service. Simplistically, leaks from distribution systems can be modeled as the equivalent to an orifice in a pipe or tank, where the leak flow is dependent on the flow in the pipe, the pressure (head) and an orifice coefficient. While in practice there is a wide variation in orifice conditions2, reducing the operating pressure of the distribution system from 75 psi to 65 psi can reduce leak flows from 10 to 30 percent. With the consequence of aging infrastructure able to potentially bankrupt some utilities, they must begin to operate their systems more gently to reduce the potential for catastrophic failures. To do so means better flow and pressure management in the distribution systems to reduce the occurrence of pressure spikes and transients that have a direct impact on the survivability of pipes. Again, understanding the real-time demand, incentivizing data-driven DSM, and effectuating pressure control mechanisms will go a long way to achieving that goal. Adopting these emerging near-real time platforms into operations management can help return control to the utilities. Incentivizing demand reductions and controlling pressure while continuing to preserve revenue will allow utilities to reduce operational costs and extend the life of existing systems. These operating expenses and capital expenditure savings can help utilities remain fiscally and functionally viable for many years.References:
- L. Bettencourt, J. Lobo, D. Helbing, C. Kühnert, and G. West, “Growth, Innovation, Scaling and the Pace of Life in Cities,” PNAS 104, no. 17 (April 24, 2007)
- J. van Zyl, and C. Clayton, “The Effect of Pressure on Leakage in Water Distribution Systems”, Proceedings of the Institution of Civil Engineers – Water Management, 60 (2).
- J. van Zyl, and C. Clayton, “The Effect of Pressure on Leakage in Water Distribution Systems”, Proceedings of the Institution of Civil Engineers – Water Management, 60 (2).