
A note from Robert X. Perez:
Welcome back to Compressor University!
We are constantly asked to push our machinery a little harder. The days of underloaded, overdesigned machines have gone by way of the dinosaurs, eight-track tapes and slide rules. After numerous process nudges, prods and rerates, we are finding some machines are operating against the proverbial wall. When we go too far, our machinery begins talking to us by failing prematurely or, in extreme cases, failing catastrophically.
Judiciously determining the safe and reliable operating limits of process machinery is one of the most critical responsibilities of machinery professionals. Ultimately, this function requires us to weigh process throughput against machine life or welfare. Many years of working in production environments have taught me that it is always better to operate at lower reliable rates than to operate at higher rates that can lead to upsets and outages in order to maximize process profit. In other words, slow and steady is better than fast and reckless. Finding the operating point that satisfies the process folks without adversely affecting machinery life is the key to profitable, carefree production.
In the next three installments of Compressor University, Atkins, Hinchliff and McCain discuss compressor load ratings that can limit processes that use reciprocating gas compressors. They will walk you through the definitions developed to protect compressors from various types of overload conditions. By the end of their articles, the reader should understand the history of rod loads and how they are computed. Remember that it is ultimately the user/owner's responsibility to select the proper loading limit criteria for his situation. Those who work with reciprocating compressors on a regular basis should keep all three parts of this article for future reference.
Introduction
Reciprocating compressors are usually rated in terms of horsepower, speed and rod load. Horsepower and speed are easily understood; however, the term rod load is interpreted differently by various users, analysts, OEMs, etc. Rod load is one of the most widely used, but least understood, reciprocating compressor descriptors in industry. Typical end users know that rod load is a factor used to "rate" a compressor, but they do not generally have a good understanding of how this rating is developed and how to utilize it for machinery protection.
These three articles discuss the various definitions of rod load, including historical and current API-618 definitions, manufacturer's ratings and various user interpretations. It also explains that there are load limits based on the running gear (moving parts such as pistons, rods, crosshead, crankthrow, etc.) as well as load limits based on the stationary components (frame, crosshead guide, etc.).
The basic kinematics and forces acting on a slider-crank mechanism will be reviewed to provide a better understanding of the various definitions used. Analytical results and field rod load measurements will be compared to illustrate the various factors that influence rod load on typical compressor installations.
Basic Theory
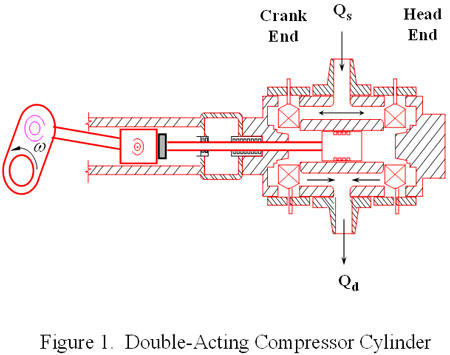
Consider the typical double-acting compressor cylinder geometry illustrated in Figure 1. The loads (forces) that are generally of concern include the piston rod loads, the connecting rod loads the crosshead pin loads, the crankpin loads and the frame loads. As the crankshaft undergoes one revolution, all of these loads vary from minimum to maximum values. The loads are generated by both gas and inertia forces.
Gas Loads
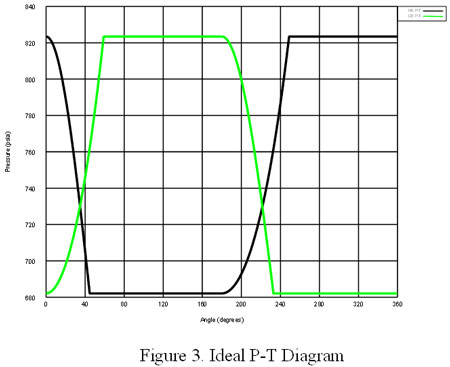
As the compressor piston moves to compress gas, the differential pressures acting on the piston and stationary components result in gas forces illustrated in Figure 2. An ideal pressure versus time diagram for a typical double acting compressor cylinder is shown in Figure 3. The pressures acting on the piston faces (head end and crank end) result in forces on the piston rod. The force acting on the piston rod due to the cylinder pressures alone alternates from tension to compression during the course of each crankshaft revolution.

It is straightforward to compute the net force on the piston rod due to pressure. A plot of this force versus crank angle for the ideal P-T diagram is shown in Figure 4. The forces due to pressure also act (equal and opposite) on the stationary components.
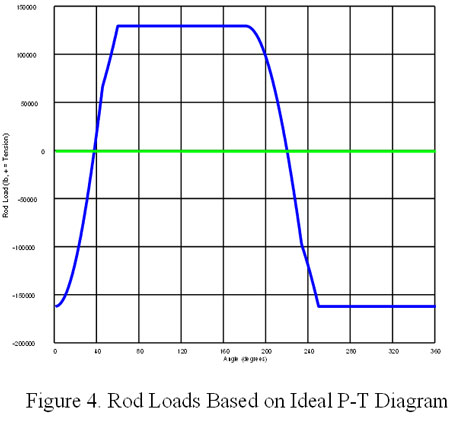
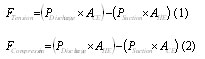
The maximum compression force due to pressure occurs when the head end is at discharge pressure and the maximum tensile force due to pressure occurs when the crank end is at discharge pressure. Therefore, the equation in Figure 2 is often evaluated at the extremes in Equations 1 and 2:
Consider a more realistic pressure versus time diagram as shown in Figure 5. Line pressure refers to the pressure at the line side of the pulsation bottle (suction or discharge). Flange pressure refers to the pressure at the cylinder flange.
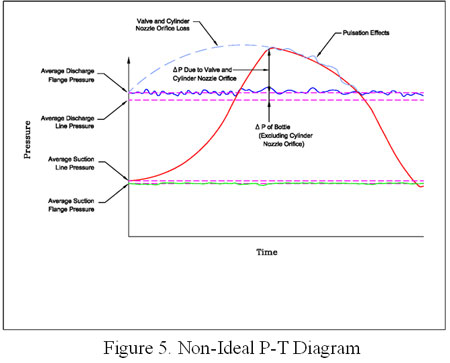
As shown, the in-cylinder discharge pressure exceeds the nominal discharge line pressure, and the in-cylinder suction pressure is less than the nominal suction line pressure due to several effects:
- Pressure drop due to valve and cylinder passage losses (typically 2 to 10 percent)
- Pressure drop due to pulsation control devices (typically <1 percent)
- Pulsation at cylinder valves (typically <7 percent)
- Valve dynamics (inertia, sticktion, flutter, etc.)
API-618 specifies that the internal pressures must be computed, but does not define any calculation procedure. There are several methods for accounting for the non-ideal effects. One common method is to model the valve as an orifice and then the pressure drop though the valve (valve loss) is proportional to the square of the piston velocity (flow). This is illustrated in Figure 5. Theoretically, it would be more accurate to use the results of the valve dynamics analysis coupled with the digital pulsation simulation to model the instantaneous pressure at the valves. This is not practical to do until all of the piping and valve details are known. In any case, the difference should be small provided the losses are within the typical values listed above.
Because of these effects, the forces due to differential pressures are higher on both the running gear and the stationary components than those calculated based on nominal line pressures. However, Equations 1 and 2 are still applicable as long as the appropriate pressures (discharge pressure higher than nominal discharge pressure, suction pressure lower than nominal line pressure) are used. If the nominal pressures at the suction and discharge cylinder flanges are used for PSuction and PDischarge, then these tension and compression forces represent the term flange loads as interpreted by some users. Equations 1 and 2 are easy to evaluate and for many years were the basis for rating "rod loads" of reciprocating compressors.
Of course, for the general non-ideal compressor cylinder, the maximum discharge pressure on the head-end will not necessarily occur at the same instant that the minimum suction pressure occurs on the crank-end and vice versa. Therefore, it is common to evaluate the gas forces versus crank angle at discrete steps (e.g. every 5 or 10 degrees). The history of these types of calculations is discussed below, but computing the instantaneous force due to differential gas pressures is easily accomplished with computer-based software. If the actual in-cylinder pressures are used and the extremes are evaluated, these forces are then the gas loads referred to in the API specifications.
Piston Rod Loads
The basic slider crank mechanism is illustrated in Figure 6. The exact equation for the position of the crosshead with respect to the x-direction shown is Equation 3.
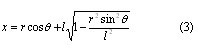
The piston (crosshead) motion is usually approximated using the first two harmonics of the Taylor series in Equation 4.
![]()
The piston rod loads can be evaluated by considering the free body diagram in Figure 7. The forces acting on the piston rod are the gas forces due to differential pressures acting on head end and crank end piston areas plus the inertia forces due to the reciprocating mass.
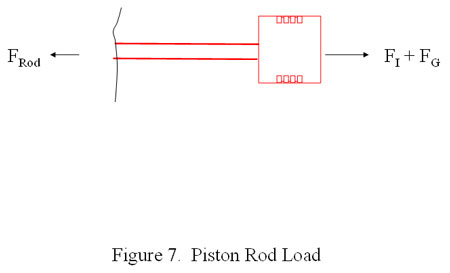
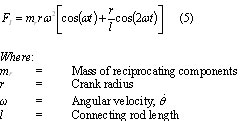
If the reference point is chosen as the crosshead end of the piston rod, then the reciprocating weight will include the piston rod and the piston assembly (piston, rings, rider bands, etc.). The reciprocating inertial force (F=ma) can be computed using Equation 5.
The combined piston rod load is the sum of the gas force and the inertial force. In accordance with API-618, this value is routinely calculated in the design stage and used along with the rod area at the minimum cross-section to compute tensile and compressive stresses in the piston rods. The stress in the piston rod is one factor to consider in the design, and in some cases it may be the limiting factor or the "weakest link in the chain." However, this load is not the rod load to which API-618 refers.
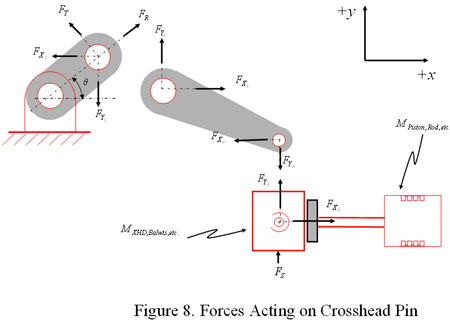
Crosshead Pin Loads
The free body diagram for the system including the crosshead pin is shown in Figure 8. Here the mass of the crosshead assembly (crosshead, balance weights, crosshead shoes, etc.) must be considered, but the same equations apply. The combination of the gas loads and inertia loads evaluated at the crosshead pin in the direction of piston motion are the "combined rod loads" to which API-618 refers. This load does not consider side forces on the crosshead or the 1/3 of the connecting rod weight that is usually considered to be reciprocating. Thus, rod load by API definition is not really a rod load, but actually a pin load.
Crankpin Loads
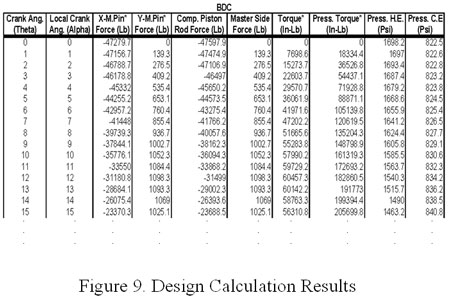
If the loads and torques throughout the system are evaluated, then the rotating and reciprocating inertias as well as the side forces are included. Equations are applied for computing x and y components of crankpin and wrist pin loads, crank throw torques, main bearing loads, etc. The typical output of the computer program used to evaluate these loads is shown in Figure 9. All of these loads are typically considered in the design stage. Different OEMs evaluate the loads per their own experience.
API guidelines are discussed in Part Two, which will be featured next month.
Originally presented at the 2005 Gas Machinery Conference in Covington, KY, October 2-5, 2005
