
Starting can have a significant effect on the life of the winding insulation of an AC motor. For this reason, motor manufacturers often limit the number of starts per hour and may also require a minimum run time and off time between starts. There are two events that occur during across the line starting that can reduce insulation life.
When started across the line, a typical AC induction motor experiences an inrush current that can be 10 to 20 times greater than its full load current. This higher current is required to establish the magnetic field in the stator core. Its intensity and duration (a fraction of a second) is independent of the load and depends entirely on the motor design. Another starting component, known as locked rotor current, can also be high (five to seven times full load current), and its intensity and duration depends on the load type and the time required to attain normal slip speed. In variable torque loads (centrifugal pumps), the intensity and duration of locked rotor current depends on the inertial loads contributed by the various components of the system.
Even though both of these high current levels exist for a relatively short period of time, they can create hot spots in the stator, which can lead to local failures and also contribute to an increase in overall winding temperature. Since insulation life is reduced as temperature rises, the additional heat generated during starting can be a major factor if starts exceed the recommended number per hour.
In addition to increased temperature, motor starting has another effect on the stator windings. According to Newton's third law of motion, for every action there is an equal and opposite reaction (an interaction). In any interaction (in the case of an AC motor, interaction is between the magnetic fields of the stator and rotor), a pair of forces is always equal in magnitude but opposite in direction. During starting, the action is the force of the rotating magnetic field in the stator on the stationary rotor. The equal but opposite reaction is the force on the rotating magnetic field that arises from the inertia of the rotor and the load it is driving. The effect of this interaction is a minute movement of the stator windings that can gradually erode the insulation.
Although a variety of pump applications use across the line starting, one of the more popular is wastewater pump down. In these applications, the pump starts when the wet well reaches a maximum level and shuts off at a minimum level. The run time and starts per hour depend on the pump flow rate, wet well capacity and the inflow volume. It is important that all three of these factors are integrated into the design of a pump down system to meet the motor manufacturer's requirement for maximum starts and minimum on and off times.
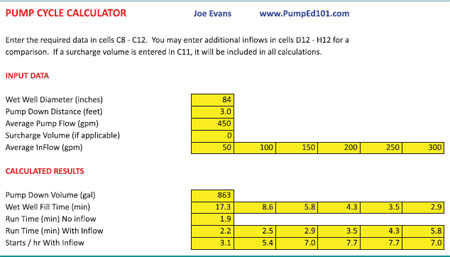
Figure 1
The screen shot shown in Figure 1 is my Excel-based Pump Cycle Calculator. Once a system curve has been developed, it will allow you to evaluate a particular pump selection based on the three factors mentioned above. Upon entry of the required data, the calculator computes the pump down volume, the fill time at various inflow rates, minimum run time, run time at various inflow rates and the starts per hour. At an inflow of 250 gpm, the pump shown in the example would start about eight times per hour and remain off just 3.5 minutes between starts. If this were a higher head pump that requires 10 hp or more, these conditions would probably be unacceptable. There are several ways to fix this problem. If the entered flow rate must be maintained, the wet well diameter and/or pump down distance can be increased. If wet well changes are not practical, a pump with a reduced flow rate can be substituted.
You may have noticed an optional piece of input data that you did not recognize-surcharge volume. Up here in the Northwest, the surcharge volume is most often associated with storm water pumping systems, but it is sometimes seen in traditional wastewater applications. It represents the additional volume that can be stored in the inflow piping and manholes, a lagoon or even a street. These areas can provide substantial storage volume and inflow duration. The maximum elevation of the surcharge storage will be the same as the maximum allowable wet well level. This calculator is also designed for use with systems that use surcharge areas. If a surcharge volume is entered, the average inflow values should reflect the effect of surcharge volume on maximum inflow.
