When selecting a pump for variable speed operation, a number of conditions must be evaluated. For example, will the performance curve allow the range of operation required by the application? Will the frequency range be large enough to allow stable operation? What is the hydraulic efficiency from minimum to maximum flow? What level of power savings can be expected? These are some of the important questions that arise during the pump selection process and there are several others.
Over the past 20 years, I have written a number of white papers that address variable speed pump selection. I have also developed several spread sheets that provide a graphical view of a pump's performance when operating under VFD control. My most recent excel program, “VSPAnalysis,” combines the information provided by several of the other spreadsheets into a single, user-friendly version. It can also be used with other variable speed controllers such as adjustable magnetic couplings. When used in conjunction with “VFPPA” (see “Pump Ed 101,” Pumps & Systems, October 2010), it will provide just about all the information needed for evaluating simplex and multiplex pumps for operation in a variable speed application. Both are available for download at the “Pump Sizing, Selection & Testing Tools” page of www.PumpEd101.com.
Figure 1 is a screenshot of the data entry tab of VSPAnalysis. Scroll down below the data entry area to view detailed instructions and an overview of the example that is included. The overview explains the information that is presented in the other tabs. The data required includes:
- Pump flows and corresponding heads
- Hydraulic efficiency at each flow point
- Design point information
- Best efficiency point (BEP)
- Motor parameters
- Utility charges
The static and friction heads at each flow point for generation of a system curve can also be entered. The “Pump Head,” “Pump Eff,” “Pump BHP (brake horsepower),” “kW per 1000 Gal” and “Cost per 100 Gal” tabs show the variable frequency curves from 30 to 60 hz with data labels that are specific to the tab name. The “Useful Calculations” tab provides automatic calculations for specific speed (Ns), suction specific speed (Nss) and several BEP and design point calculations. If you enter impeller eye diameter, it will also calculate suction energy (SE). You can add other calculations as needed.
.jpg)
Figure 1. Screenshot of the data entry tab of VSPAnalysis
In the example on the site, a pump that must meet a range of flow from 1,000 to 1,850 gallons per minute at the system heads is evaluated and shown in Step 7.
Figure 2 represents the types of charts shown by the tabs (“Pump Head” tab through the “Cost per 1000 Gal” tab) on the site. The one shown is the pump hydraulic efficiency versus system head across the range of flow. It also shows the slope of the efficiency isomers as pump speed (in hz) is reduced and how they intersect the system curve.
This particular pump has a hydraulic efficiency of 85 percent at the design point (full flow) and maintains an efficiency of approximately 84 percent at minimum flow. Intermediate flows peak at 86 percent. This represents an excellent range of efficiency and will have a large impact on energy savings and the cost of operation. The slope of the efficiency isomer is also important. At 1,000 gallons per minute, the efficiency of the 60 hz curve is 80 percent. However, at the reduced speed required by the system curve, efficiency increases to almost 84 percent due to the leftward migration of the 1,250 gallons per minute efficiency point.
.jpg)
Figure 2. A sample chart from one of the VSPAnalysis tabs
Tabs 3 through 6 show the same system curve, frequency curves and design point. The difference is the data label values. The “Pump Head” and “Pump BHP” tabs show the head produced and BHP required at various flow and frequency points. For the example, the BHP ranges from 34 horsepower to 76 horsepower across the range of flow. It also shows a 25 BHP reduction at 1,000 gallons per minute versus control valve operation. The “kW per 1000 Gal” and “Cost per 1000 Gal” tabs show the power and cost per thousand gallons pumped. The cost per 1,000 gallons pumped ranges from 0.051 to 0.057 cents. All the tabs show an operating range of 10 hz from minimum to maximum flow. This is more than adequate to provide stable operation and reduce hunting and over reaction to flow changes.
Figure 3 shows the information that is automatically calculated in the “Useful Calculations” tab. This is a work in progress and changes based upon input from users. The left hand column shows the calculations for specific speed, suction specific speed and suction energy. Entry of the impeller eye diameter is required to calculate Suction Energy. Suction specific speed and suction energy vary with a change in speed, unlike specific speed. This is due to the change in NPSHr.
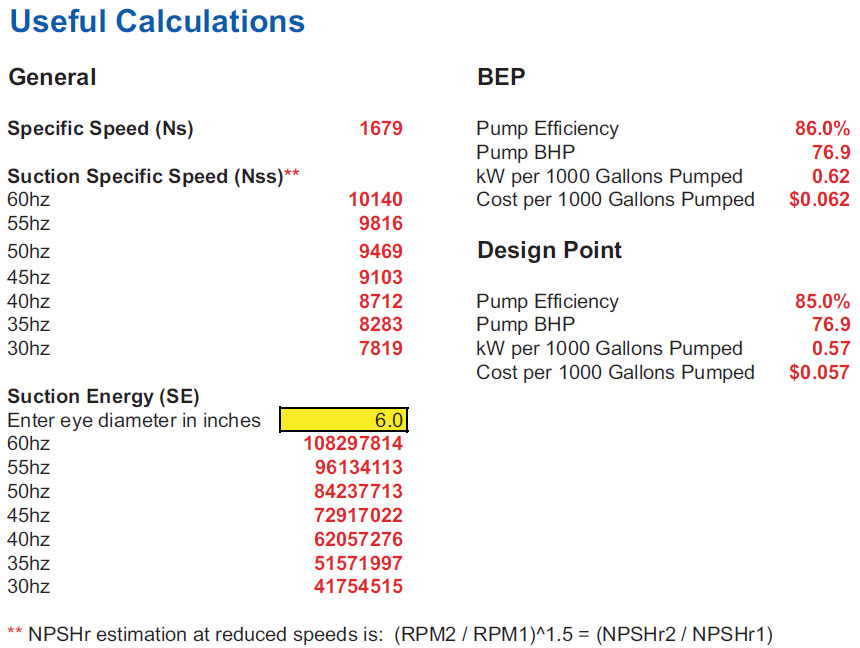
Figure 3. Automatically calculated information that can be found at the “Useful Calculations” tab
The calculator uses the generally accepted equation shown at the bottom of the column to estimate the change in NPSHr as speed is decreased. See “Pump Ed 101,” Pumps & Systems, February 2010, for a detailed description of suction specific speed and suction energy. The right hand column shows several calculations at BEP and the duty point.
Pumps & Systems, January 2011