Last month, we ended with a discussion of the relationship between peak and RMS (or effective) voltage. We found that the RMS voltage will always be 0.707 that of peak voltage, and peak voltage will always be 1.414 that of RMS voltage. This relationship holds true regardless of the sine wave frequency. But, as frequency changes, the total voltage applied to a circuit per cycle can differ substantially. To visualize this difference, we will need to introduce another unit of measure-volts per hertz.
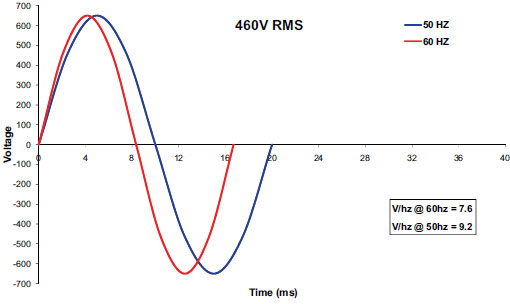
Figure 1
Figure 1 shows one cycle of a 50 and 60 Hz, 460 V AC sine wave with peak voltages of 650 V. The 60 Hz curve finishes one cycle in about 16.66 milliseconds while the 50 Hz curve requires 20 milliseconds. If you look at the positive section of the two curves, note that the area under the blue curve is greater that the area under the red curve. The same is true for the negative portion although it is not as apparent. During a period of one second, both will produce identical total voltages in the circuit, but the total voltage per cycle (Hz) will be greater for the 50 Hz curve since the number of cycles is just 5/6 that of the 60 Hz curve.
This relationship is analogous to that of the torque produced by two pole (3,600 rpm) and four pole (1,800 rpm) motors of the same horsepower. If a four pole motor is to do the same amount of work as a two pole motor, it has to accomplish twice as much work per rotation. Therefore, it must produce twice the torque.
I mentioned last month that RMS voltage is related to the heating equivalency of AC versus DC. In the case of resistive circuits (heaters, incandescent lights, etc.), AC frequency does not have a major impact, but it is especially important with inductive devices (especially motors). (We will cover resistive and inductive circuits next month.) To keep motor flux and the torque it produces constant, the volts per Hz (cycle) must remain constant at all frequencies. The box in the lower right of Figure 1 shows the Volts/Hz ratio for both curves. It is 7.6 for the 60 Hz curve but increases to 9.2 for the 50 Hz curve.
Figure 2 shows the simple fix to this discrepancy. By lowering the peak voltage, we have decreased the RMS voltage of the 50 Hz curve to 380 V (5/6 of the 60 Hz RMS voltage) and balanced the V/hz ratios of the two frequencies. In countries that use 50 Hz power, phase voltages are applied at lower intensities to keep V/hz constant. Examples of these reductions include 480/400, 460/380 and 240/200. All 50 Hz values are 5/6 of the 60 Hz value. This also occurs here in the United States in variable speed applications. When a variable frequency drive reduces frequency to control speed, it also reduces voltage proportionally and maintains a constant V/hz ratio.
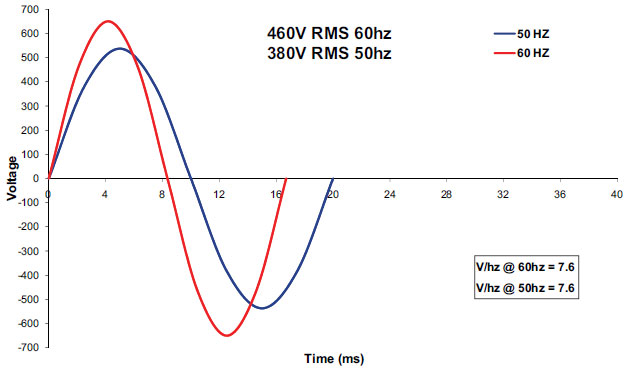
Figure 2
The Three Phase Curve
If you thought that the single phase curve was complex, look at the three phase power curve in Figure 3. It shows the output of a generator wound in a manner that produces three separate single phase curves, each separated (or, out of phase) by 120 electrical degrees. Phase 1 begins at 0 deg, phase 2 begins at 120 deg and phase 3 begins at 240 deg. From 240 deg on, all three are contributing to the overall power in a circuit.
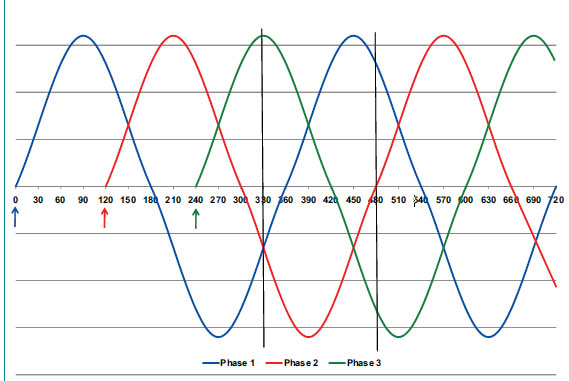
Figure 3
What is the purpose of three phase power? After all, it appears pretty complex. Actually, it is not nearly as complex as it may first appear. The three phase curve is simply the combination of three single phase curves, and each is transmitted from the generator to its point of use by a separate wire.
Why three phases instead of two or four? One big advantage that three phase power has over single phase power is the fact that, at any given point in time, one of the three phases is nearing a peak, and there is never more than one phase at zero. If you look at one cycle (Hz) of Phase 1 (blue curve from 0 to 360 deg), you will note that the wave crosses zero volts twice during its cycle. It also spends about one third of its time below 50 percent of peak voltage. Although single phase can be more than adequate for low power applications, it becomes problematic as the demand for power increases.
The two vertical black lines at 330 and 480 deg illustrate the advantage of three phase power. At 330 deg, phase 3 is at its peak while phases 1 and 2 are contributing about 38 percent of their peak voltages. At 480 deg we see a worst case. Even though phase 2 is at zero, phases 1 and 3 are contributing about 87 percent of their peak voltages. You will find that this relationship holds true at any point on the x axis. Two phases will also reduce this “zeroing” effect but not nearly as well as three phases. Higher horsepower motors and other devices such as welding equipment will therefore have a more even power output when operated on three phase power. Four phases would not improve things significantly and would add the expense of a fourth wire, so three phase was the natural settling point.
Another important feature of three phase power is that it creates a natural rotating field in the stator of an induction motor. This is due to the 120 deg separation among the phases and results in alternating positive and negative peaks that occur every 60 deg. For example, a three phase, two pole stator actually consists of six poles or two poles per phase. The primary and secondary poles are spaced at 60 deg intervals and take advantage of the phase voltage peaks that occur at the same intervals. In the case of a two pole, single phase motor, two poles are located 180 deg apart. Because no poles are in between, no rotational field is generated and some additional starting technique is required for rotation to begin.
Next month we will explore the characteristics of resistive and inductive circuits.
Click here to read Part One of "AC Power"
Pumps and Systems, July 2010