
Vibration monitoring can be an early warning of problems developing inside rotating machinery. As companies migrate from a passive run-to-failure approach to a proactive/preventive maintenance method, questions are asked about how to start, what approach to choose and how sophisticated a vibration monitoring plan needs to be.
In past issues of Pumps & Systems, I have touched on different methods that can be used to effectively strike a balance between sophistication and pragmatism. Not every plant needs a full-blown transient electric current analysis as described in “Transient Startup Problems for Pumps with Synchronous Motors,” September 2007. In this article, high-speed, real-time, start-up fluctuations of the motor amps were analyzed, and motor tripping problems were solved after several months of complex testing.
A better way to begin is to identify critical equipment. Every piece of equipment does not need to be part of a vibration monitoring program. Once the critical equipment has been selected, begin recording the trend of vibrations with a simple hand-held vibration analyzer, which shows the overall root mean square amplitude (RMS) values of vibration. See “Trending Revelations in Vibrations Analysis,” June 2009. This article described the manner and logistics of vibration program philosophies that plants tend to follow. The machinery survey usually precedes the formal launch of the program to determine the most critical machinery to monitor. See “Pump Reliability and Energy Surveys,” December 2009.
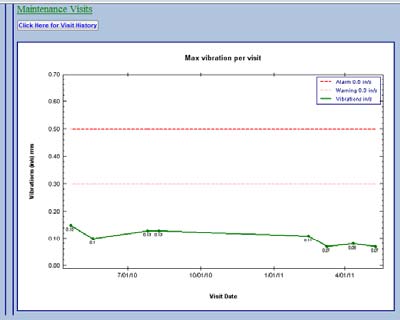
Figure 1. Vibration data for failing pumps
By the end of 2009, I received feedback and many questions regarding the proper balance between simple, overall vibration velocity value trending and complex fast Fourier transform (FFT) spectral analysis. This feedback was summarized in “Think Simple Before Rushing to Fancy Analysis,” August 2010; “Vibration Analysis Simplified,” November 2010; and “Facts and Fiction About Vibration,” March 2011.
“Vibration Analysis to Improve Pump Reliability and Save Energy,” September 2011, described how an initial simplified vibration program gradually expanded to include information regarding the pumps’ inefficiencies and energy consumption. Simple trending vibration methods and on-line, real-time continuous monitoring present a next step for plants that are interested in elevating their program to the next level. By using this combination, plants will be better able to predict internal problems with the machine before the problem becomes a failure. The remainder of this column focuses on a case study in which a wastewater facility in Washington, D.C., successfully used this method.
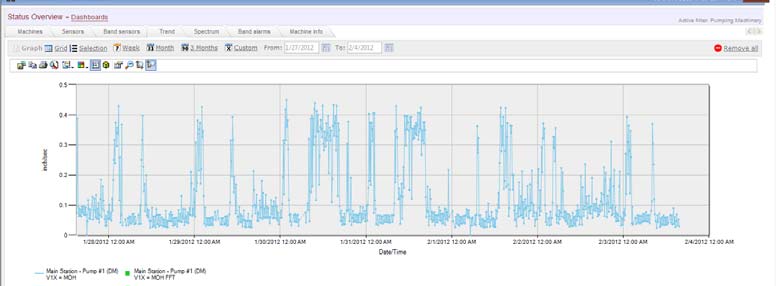
Figure 2. Vibration data from the continuous monitoring system
Wastewater Pump Vibration Trending
In 2007, a municipality in the Washington, D.C., area began tracking the reliability of its wastewater treatment facility pumps using vibration analysis. Starting with a simple analyzer, initial efforts involved the in-house rotating machinery technician examining any pump with high vibrations.
Because the municipality had several plants and a large number of pumps, servicing the units at the early signs of trouble was difficult. By the time a problematic unit was examined, the internal damage (bearings, leaky seals, etc.) had progressed substantially, resulting in the need for expensive repairs and downtime.
The monitoring system
In 2009, the municipality shifted to a more regimented systematic approach, trying to catch the problem closer to its inception. This approach helped reduce the number and cost of catastrophic failures significantly. However, while the majority of pumps under the trending program were monitored monthly, occasional, undetected failures still occurred. They happened despite the trending chart showing no obvious signs of early distress, as recorded by the overall vibration data, with overall vibration being significantly below the warning (0.3 inch per second) and alarm (0.5 inch per second) values. See Figure 1 for the data.
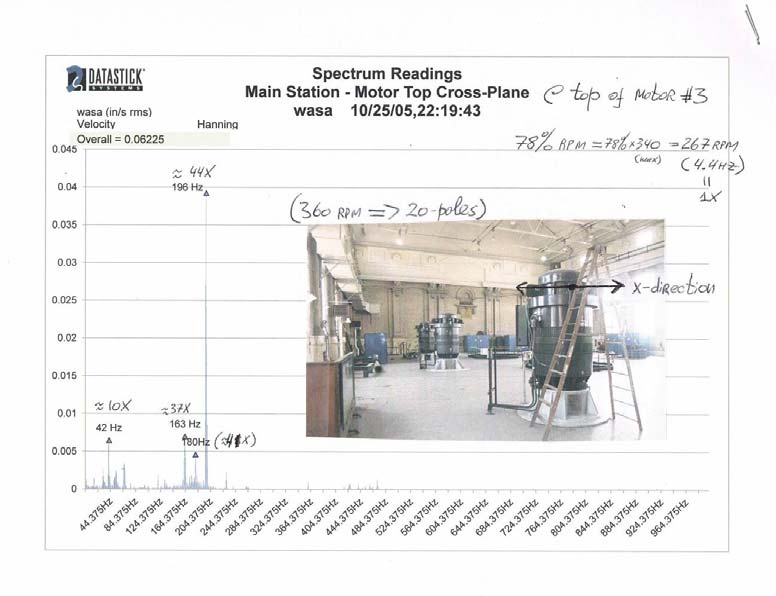
Figure 3. Full-spectrum data analysis
To understand the issue better, the plant technician and an outside consultant looked into the issue more closely. After interviewing several operators of all three shifts, they learned that the pumps tend to exhibit high vibrations at occasional and unpredicted times.
On closer review, some problems appeared to be pump- or motor-related, and others were system-related. A first discovery was an incorrect setting of the motor’s minimum speed. It was not set low enough to accommodate low-flow periods (usually at night). This caused the motor to shut down and then restart a few minutes later as the wet-well level built up again. Readjusting the minimum speed setting solved the problem of frequent starts/stops, significantly improving the impact on the motor life. However, the high vibration spikes persisted.
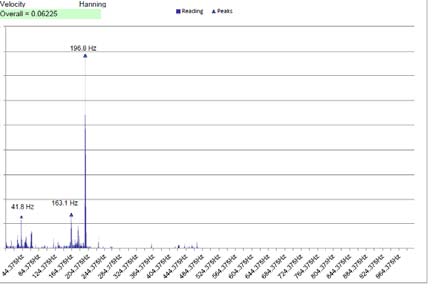
Figure 4. Bump test results
Adding Continuous Monitoring
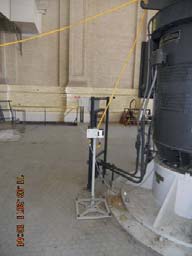
To understand the cause of the vibration spikes, a continuous vibration monitoring system was installed by the consultant. The system consisted of the data module (DM) that was installed near the motor and pump, with combination triaxial vibration/temperature sensors connected by long extension cables to the DM. The DM unit transmits a radio signal to the communication module (CM), which sends this signal to the tower and from there to the network.Plant technicians, maintenance personnel and other operators can view the data directly on their computers via the Internet from any location. As seen in Figure 2, vibrations spiked from a low level of approximately 0.05 inch per second (which is what the monthly single-measurement data tracked) to a high level acceding the warning and close to the 0.5-inch-per-second alarm level.
The vibration and temperature sensors were installed at several locations on the motor and the pump, but the high level of vibration was recorded only at the top of the motor. The lower part of the motor and the pump experienced no spikes and had low vibration readings, close to 0.05 inch per second. The full-spectrum analysis signature is shown in Figure 3.
From the FFT plot, the main high spike frequency is at 196 hertz, 44 times the running speed value of 267 rpm (4.4 hertz) at the time of the test. While the problem appeared to be located in the upper part of the motor, the specific source of its excitation was unclear. Possible culprits were:
- Resonance
- Motor electric (rotor bars)
- Variable frequency drive (VFD) harmonics and noise filtering
To determine the specific cause, an additional bump test was performed on the idling pump (see Figure 4). This test identified the natural resonance frequency of 196 Hz as the root cause. However, which component caused the resonance was unclear.
Additional tests at different positions were conducted along the entire length of the unit. These tests indicated that the highest vibrations emanated from area around the motor’s lifting lugs. There are 11 short steel ribs at the upper part of the motor housing, and two longer lugs that are used to lift the motor. The dimensions of the lifting lugs are 18 inches by 12 inches by 1 inch.
Finite element analysis (FEA) of the lifting lugs was performed to see the natural modes of frequency resonance. The first three shapes of the resonance modes are shown in Figure 5. In a simplified model, the lifting plate was estimated to be a 2-inch thick plate that was 18 inches long by 12 inches high. The exact method of the plate’s attachment to the motor frame was difficult to see without disassembly.
If most of the attachment boundary were along the short edge of the plate, the natural frequency of resonance would be somewhat less than if the plate were attached mostly along the wide edge. The true resonance was probably in-between these constraints. The mostly short-edge FEA analysis predicted 102 hertz as the first harmonic and 345 hertz harmonic later.
The bump test value of 196 Hz fell within this range, indicating a strong possibility of the predicted structural resonance of the upper side of the motor lifting lug structure, although a more accurate model would need to be constructed to get a more accurate correlation.

Figure 5. FEA results
Vibration Trending & Monitoring Benefits
Vibration trending analysis aided by the FFT spectral analysis provide a valuable tool for predicting and anticipating developing pump issues before they evolve into problems.
Such predictive maintenance also helps identify system-related deficiencies and allows for proper adjustments to fine tune and optimize overall equipment operation.
Collectively, these methods result in significant savings because of the avoided costs of catastrophic failures and results in a more informed and educated team to maintain and operate critical equipment.
Pumps & Systems, April 2012
