
Determining which pumps and their associated systems to assess is the first step in the process.
First of Two Parts
What Is a Pump Assessment?
A pump assessment is a mini performance test of the pump within the system in which it normally functions. For a pump with a small range of operational flowrates, this test might be done by taking data at one flowrate to represent the pump's normal operation.
In more complex systems, where the pump may operate over a wide range of flows and heads, the assessment may require several individual tests encompassing the range of the pump's performance requirements, or it may require continuous monitoring over a period of time to capture the operational extremes. The assessment generally requires measuring the pump's flowrate, head and power input to determine its actual operating point within its system.
Why perform a pump system assessment?
The two most common reasons to perform a pump system assessment are to enhance the reliability and/or efficiency of the pump and system.
Reliability. A pump's reliability is related to how close its actual operating point or range is to its best efficiency point (BEP). Reliability improves when the pump operates near its BEP. The BEP, as the name implies, is the flowrate and head level at which the pump achieves its highest efficiency.
Operating significantly away from this point leads to axial and radial loads from internal hydraulic forces. These forces cause shaft deflection and bearing loads which in turn can lead to seal failure, bearing failure, internal rubbing and vibration problems. Even pumps that have been properly installed and maintained experience greater reliability problems if operated away from their BEP. In addition, problems related to cavitation and suction recirculation can be exacerbated by off-design operation.
Efficiency. In today's greener world, performing a pump assessment to determine if the pump is operating as efficiently as expected has become common. Most facility managers assume that their pumps are running pretty close to their BEP. In reality, the average pump in the field operates at 44 percent efficiency . This is well below the average BEP of those pumps. In a quick study of the average best efficiency weighted by sales volume of each size of ANSI pump sold in one year from three of the largest suppliers of these pumps in the U.S. I found that the average best efficiency of this small segment of the pump population is 65 percent. These pumps are often smaller in size and designed primarily with reliability, not efficiency, in mind. So, this efficiency sample was intentionally not taken from a high efficiency portion of the population but still shows a 21 percent efficiency deficit between the average best efficiency and the average operating efficiency. This 21 percent deficit seems compelling enough to want to examine the pumps.
However, this is only the beginning of the good news. As the view is broadened and the whole system is examined, partially closed valves, open bypass lines, excessive flowrates and other issues may exist. System efficiency, rather than pump efficiency, is where the real efficiency deficit lies. It is not uncommon to find systems in which pump energy costs can be cut by 50 percent when the proper pump is installed and the system is operated properly.
A common example of a system that continuously wastes energy is one in which a throttling valve is used to control flowrate. Most operators are shocked when they learn the actual operating cost of a partially closed valve. Consider a system with a valve that is partially closed (10 psi pressure drop) and 500 gallons per minute (gpm) passing through the valve. If the pump and motor have efficiencies of 65 percent and 95 percent respectively, the system runs continuously, and the cost of power is $0.08 per kilowatt hour. The cost of energy loss across that valve is $2,790 yearly.
How many partially closed valves are operated in facilities around the world? Operating a pump and controlling its flowrate with a throttling valve is akin to driving home with a brick on your car's accelerator and using the brake to control your speed. The valve dissipates energy in the flow, wasting it as friction. Eliminating as much friction as practical is paramount to optimizing a pump system's efficiency.
Why Do Pipe Systems Calculations and Reality Differ?
Pipe systems loss calculations are based on average friction loss data on the pipe and fittings. The generic pipe and fitting data cover a range of manufacturers, and casting and manufacturing variations even from a single manufacturer cause data variations.
A rarely noticed note found at the bottom of some pipe friction loss tables warns that the values in the table should have a safety margin of 15 percent to 20 percent added to cover variation. To improve the accuracy of your calculation, system loss calculations should be run with pipe and fitting loss data from the actual manufacturers being used on the project.
A second reason that design and reality fail to match is the difference between design and as-built conditions. It is often instructive to take a piping and instrumentation drawing and walk down the system. Often, components and branches that are not shown on the drawing exist in the system.
Another reason that the pump and system can be mismatched is a change in the function of the system over time. Often, systems are tasked to pump different fluids or provide flow to more or fewer systems than planned in the original design.
The last reason, but certainly not the least, is that the pump was poorly selected in the first place. This can be because of poor initial specifications or just a bad choice. A classic error is the “fudge factor.” No one wants the pump to be too small, so everyone adds their +5 percent to the pump size, so when the pump is installed it is 10 percent to 15 percent larger in flow and head than it needs to be. A pump that is 10 percent oversized in flow and head requires 21 percent more energy to run than the properly sized pump.
Initial assessment
For most facilities there are far too many pump systems to do an assessment on each one. So we must reduce this to the few that offer the most promise. If the goal is reliability improvement, the selection may be as simple as a review of your biggest maintenance troublemakers.
Many pumps that chronically suffer from bearing and seal issues are often not running at their BEP. If the goal is to improve system efficiency, the following series of mental filters has proven useful in finding systems with the largest impact on reducing pump system energy costs.
Filter 1. The first filter separates the higher horsepower equipment from the lower. The theory is that the larger equipment will have a larger potential for reducing energy costs. The term higher horsepower is a bit subjective. In the training course for the Pump System Assessment Tool (PSAT) from the US Department of Energy, it is suggested that equipment which uses more than $20,000 per year in energy is a good candidate. This cost can be calculated using the following formula:
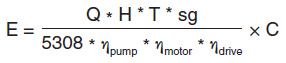
Where:
E = energy (kilowatt hours)
Q = flowrate (gpm)
H = head (feet)
T = operating time (hours/year)
sg = specific gravity (dimensionless)
5308 = units conversion constant
ηpump = pump efficiency (decimal)
ηmotor = motor efficiency (decimal)
ηdrive = drive efficiency (decimal)
C = Cost of power ($/kilowatt hour)
Filter 2. The second filter separates centrifugal from non-centrifugal pumps. While positive displacement pumps certainly have room for optimization, they are beyond the scope of this article.
Filter 3. This filter separates pumps that have a high number of operating hours per year from those that do not operate very often. Pumps that do not operate very often are less likely to use a significant amount of power. One thing to watch for with large equipment is that even occasional use might set the energy demand charge on your power bill at a much higher rate.
Filter 4. If the pump is currently controlled by a variable frequency drive (VFD), assume that there is enough control over the pump to optimize its operation individually. Only units that are currently not using VFD control will be considered in the first round of energy assessments.
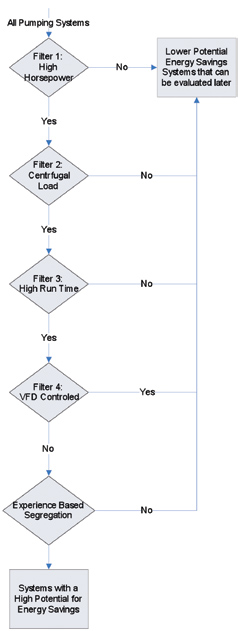
At this point, the filters have reduced all of the pump systems in the facility, down to centrifugal pumps with high horsepower drives, significant operating hours, which do not have VFD control. This should produce a manageable number of pump systems for potential assessment.
The final filter is based on experience with the actual systems. Factors such as high maintenance costs or frequent seal and/or bearing failures can be key indicators of a poorly matched pump and system. When inspecting the system, personnel may find throttled valves as discussed previously.
Another indicator of inefficient operation is a continuously open bypass line. This is constantly pumping fluid, that you have paid to add energy to, back to the suction side of the system, wasting all that energy. Another indicator of possible inefficient operation is cavitation noise. This can indicate that the pump is running at a flowrate much higher or lower than its designed rate.
In a system with a large range of operational flowrates and multiple parallel pumps, often the same number of pumps is always running. In times of low demand, too many pumps may be running. While none of these symptoms guarantee system efficiency problems, they help to further identify the high potential systems so they can be ranked and assessed.
Once the systems are sorted to a manageable number that can be further evaluated, a system should be selected as a test case. If this is a new part of a company's energy management process, getting a big win on the first project is important. The system should be one that is assessable without a huge expense in equipment and/or consulting. It should also be one with an expected sizable financial impact.
Software and Training Support
Free software programs are available for used to help companies evaluate pump systems, such as the Pump System Assessment Tool (PSAT) from the U.S. Department of Energy. Additionally, seminars are offered by the Hydraulic Institute/Pump Systems Matter (Pump System Optimization, http://www.pumpsystemsmatter.org/content_detail.aspx?id=2784) and the U.S. Department of Energy (Pump System Assessment, http://www1.eere.energy.gov/industry/bestpractices/pumping_systems.html).
Part Two of this article will look at taking the data and using software tools to help you successfully assess your pump systems.
Pumps & Systems, November 2010
