Pumps & Systems, March 2013
Biological-secondary treatment is the most energy-intensive phase in the wastewater treatment process with aeration consuming between 25 and 60 percent of the total energy used in a municipal plant.1 According to a report by the Environmental Protection Agency (EPA) in the U.S., these costs are increasing because of rising energy prices and more stringent requirements for effluent quality.2 An increase in environmental awareness and the rising cost of electricity have motivated operators to reduce the energy consumption of biological-secondary treatment in wastewater treatment systems.
Tests at Swedish Wastewater Treatment Plant
Full scale trials by a global water solution company show that the energy consumption of a wastewater treatment plant’s aeration system was successfully reduced by a significant 65 percent when more energy efficient equipment was installed. The tests were conducted at the Sternö Municipal Wastewater Treatment Plant in southern Sweden.
Built in 1997, the Sternö plant was designed to cater to a population of 26,000 calculated on biological oxygen demand (BOD) 7 load 70 g (pe day)-1. Aeration consumed 44 percent of the plant’s total energy usage.
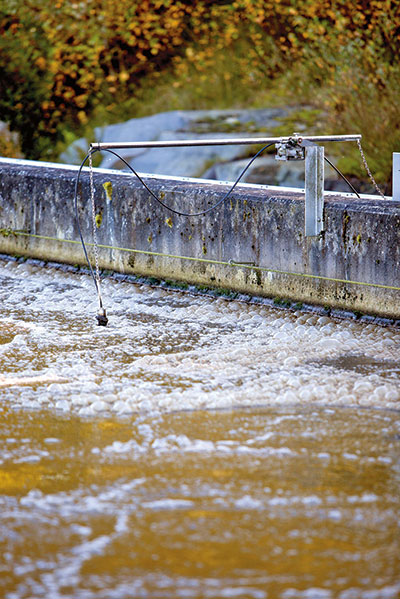
The plant consisted of two parallel biological treatment lines that performed the pre-denitrification of the wastewater. During the study, one of the treatment lines was used as a test line with the new aeration and control equipment installed. The other line with aeration equipment—consisting of tube diffusers, lobe blowers and a simple dissolved oxygen (DO) control—was left unchanged and kept as a reference line.
The new aeration equipment installed into the test line was a screw blower; fine bubble, low-pressure diffusers; and measurement equipment.
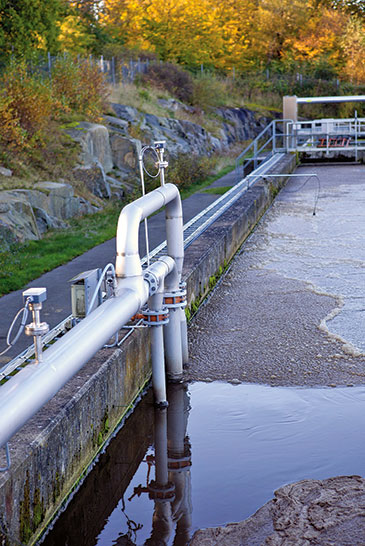
New aeration equipment.
The Results
The results of the full scale trials showed that the new screw blower reduced the energy consumption of the test line by 35 percent.
The low-pressure diffusers reduced the energy consumption by another 21 percent. By fine tuning the controllers, the oxygen concentrations and the air pressure, the energy consumption of the test line was reduced an additional 9 percent. The final energy savings of the test line were 65 ± 2 percent.
Each aeration equipment upgrade increased the energy savings with:
- Blower, 35 percent
- Diffusers, 32 percent
- Oxygen control with decreased DO concentrations and air pressure, 21 percent
The final energy savings of the test line were 65 ±2 percent.
Evaluation periods
The new installations were performed in stages. The effect of each new installation was evaluated separately, and the results were:
- Phase 1 involved the installation of a new screw blower and a non-tuned DO cascade control system. During Phase 1, the majority of the energy savings was related to the increased efficiency of the blower.
- Aeration grids were installed during Phase 2. An additional 23 percent of the total energy savings gained during Phase 2 was acquired by the high standard oxygen transfer efficiency (SOTE) and low system head loss of the new aeration system.
- During Phase 3, a process control system was installed, which increased the energy reduction by an additional 9 percent through a combination of a further decreased system head loss from the most open valve logic and the implementation of DO cascade control and an energy optimized DO profile. The DO profile was energy optimized by changing the DO set points from 1.7/0.7 milligrams per liter to 0.7/1.0 milligrams per liter, which distributed the load more evenly throughout the length of the basin.
Airflow & Aeration Efficiency
With the new system, aeration efficiency was almost three times as high in the test line compared to the reference line. The required airflow was reduced by 30 percent, and the system pressure was reduced by 15 percent. These savings were gained by a combination of:
- A more efficient blower
- A higher SOTE
- Lower head loss
- Energy-optimized DO control and DO profile
- More than 40 years of expertise in wastewater treatment system optimization
Payback Period
The payback period for implementing the aeration system was calculated at four years. If both lines were upgraded, the payback period would decrease to just three years since some of the equipment could be shared between the lines. These full-scale tests were performed throughout a 6-month period. The annual savings for the test plant was more than $28,000 if both of the plant’s treatment lines were upgraded. P&S
References
1. WEF, 2009. MOP No. 32: Energy Conservation in Water and Wastewater Facilities.
2. EPA, 2010. Evaluation of Energy Conservation Measures for Wastewater Treatment Facilities. EPA 832-R10-005.