Improved reliability, performance and energy efficiency can result from pump system assessment.
Second of Two Parts
In Part One of this series (Pumps & Systems, November 2010), a method was developed to determine which pump systems in a facility offer the best opportunity for significant cost reduction through energy conservation and reliability improvement.
After selecting a candidate system, data must be taken to determine its actual operating point or operating range. For a system with a small operating range, only a simple, one-point test may be needed. Systems with a larger range of operation may require a performance test at each of several operating conditions to understand the scope of operation. More complex systems or systems of which little is known about the operating range may need continuous monitoring over a period of time to capture the operational extremes.
Data Needed to Assess a Pump System
A pump assessment is a mini performance test of the pump within the system in which it normally functions. The assessment generally requires measuring the pump's flow rate, head and power input to determine its actual operating point within its system. Specifically, collected data should include:
1. Pressures
a. Suction
b. Discharge
2. Flow rate
3. Pump input power
4. Shaft speed
5. Fluid properties at the operating condition(s)
6. Pump performance curve (from the manufacturer)
7. Motor performance—Possibly the VFD performance also (from the manufacturer)
Warning—Before any data collection is begun, all data must be collected by trained and qualified personnel. Data collectors will be connecting test equipment to live electrical wires and to rotating equipment. All company, local, state and federal safety protocols must be followed including but not limited to NFPA 70E and OSHA 29CFR 1910.335. If any reservations in the collectors' ability to gather these measurements safely arise, consult a professional for assistance.
Pressure Gauges
Pressure gauges are often permanently installed on pumps but these may not be the gauges that should be used during an assessment. Because of pressure spikes, water hammer, fouling, etc., these gauges are often inaccurate. If safety permits, mount accurate pressure gauges onto the system. The gauges should be of good quality and accurate enough to read pump suction and discharge pressures within +/- 3 percent.
Be aware that the suction pressure may be below atmospheric, requiring a compound gauge (able to read both positive and vacuum pressures). The gauges should be mounted as close to the pump as possible to eliminate potential errors caused by losses in pipe fittings.
The head level in and out of the pump must be determined. The difference between the inlet head (input energy) and the discharge head (exiting energy) is the amount of energy added to the flow measured in foot-pounds per pound. If only the inlet or outlet head or pressure is known, determining the amount of energy transferred to the fluid is impossible. The formula to convert pressure to head is (see nomenclature listing below for definition of terms):
hg = (P x 2.31)/SG
If a suction gauge is not available, as on a vertical immersion sump pump, use the level of the fluid above the inlet to the impeller to determine the suction head level. The equation to determine suction head from a fluid level measurement is:
Hg = [(GP x 2.31)/SG] + hvs ± Zs - hfs
Flow Rate
The next required measurement is the flow rate through the pump system. This can be determined by an inline flow meter that is permanently installed in the system or by one installed temporarily for the test. Whichever method is used, the flow meter needs to be installed correctly with the proper amount of straight pipe before and after the meter.
Temporary flow meters must not change the system loss characteristics during the measurement. A popular type of temporary flow meter is an ultrasonic flow meter. It uses changes in a sound signal passed through the pipe and the flow to determine the velocity of the flow in the pipe. This is non-invasive and does not require the pipe to be penetrated. However, they can be temperamental and error prone when misapplied.
Another type, common in some industries, is a pitot tube that measures velocity by determining the difference between the total and static pressures in a flow. There are several other insertion type meters, including paddlewheel and turbine-type meters. All these meters require that the internal diameter of the pipe be known so that the velocity and the pipe's internal cross sectional area can be used to find the volumetric flow rate.
Flow rate = velocity x cross sectional area
Cross-sectional area = (Π x D2)/4 (for round pipe)
| Nomenclature | |
| H | Total head (feet) |
| P | Pressure (psi) |
| SG | Specific gravity (no unit) |
| hg | Head (from gauge pressure) (feet) |
| hvs | Velocity head (suction side of pump) (feet) |
| hfs | Friction head loss (suction side of pump) (feet) |
| Zs | Elevation head (level of liquid above pump impeler inlet) (feet) |
| Hs | Total head (suction side of pump) (feet) |
| GP | Gas pressure (applied to liquid surface, zero if open tank) (psig) |
| D | Internal diameter of the pipe (feet) |
Shaft Speed
Shaft speed has changed from a number that could be guessed to a parameter that must be measured. Efficiencies of electric motors have been increased with a complimentary reduction in slip. This means that motor speeds have increased, moving closer to their synchronous speeds.
When taking performance measurements, this may lead to significant changes in the pump's performance in both head and power consumption. This measurement does not need to be extremely accurate. Knowing the shaft speed within ±5 rpm is acceptable in most cases.
Sometimes, this can be done using an inexpensive contact-type tachometer. Generally, these use a rubber-tipped shaft that is pressed against the pump or motor shaft, directly measuring the shaft's rpm. This works well if there is a location available to make contact with the spinning shaft. Unfortunately, OSHA has done a good job covering all the access areas that were once accessible for the use of this type tachometer.
Non-contact tachometers are an alternative. On the lower end of expense scale are optical tachometers that use a light source bounced off a piece of reflective tape attached to the shaft. These work well but require that the pump be stopped to attach the tape to the shaft. Some non-contact tachometers, such as key-phasers or optical strobes, can be used without stopping the equipment.
Input Power
Determining input power for a pump can be as simple as taking the voltage and amperage data on the output side of the motor starter. These measurements combined with the power factor and efficiency data from the motor manufacturer will provide a fair estimate of the motor output power, which is usually the pump input power. This method works well on fixed-speed pumps.
| Due to the potential safety hazards, it is advised that all electrical meters be attached to the pumps electrical system when the power to the pump motor control center is off. This reduces the risk of electrical shock and arc flash. |
If the motor is driven by a variable frequency drive (VFD) things get more complicated. The drive output to the motor is not running on a true sine wave, and the frequency of the output may also be outside the range of the meters being used for the measurements. These two factors along with change in the power factor modified by the drive complicate measurements at this location. Many drive manufacturers suggest measurements be taken with the power meter at the input side of the drive where the power is coming in at line frequency and voltage. This requires that the efficiency of the drive at various power and frequency outputs be known. The readout on the drive's display can be used, but it is rarely calibrated and may be prone to errors.
Analyze the Data
Data analysis can be done by hand. An example document can be downloaded at www.pdcubed.net showing a complete hand calculation with the accompanying equations. These formulas can be used to develop a custom spreadsheet for those who prefer to work in spreadsheets or who have multiple data points.
Also, a free tool developed by the U.S. Department of Energy is available to help analyze your data. The program is called Pump System Assessment Tool (PSAT). It can be downloaded at http://www1.eere.energy.gov/industry/bestpractices/software_psat.html.
Input for this tool is the raw measurement data; output is the pump's performance, yearly energy usage and cost to operate. The tool also compares the current pump against a theoretical, optimum pump based on the achievable efficiency estimate generated from the Hydraulic Institute Standard. This contrast shows approximately how much money could be saved yearly if the optimal pump were installed (Figure 1).
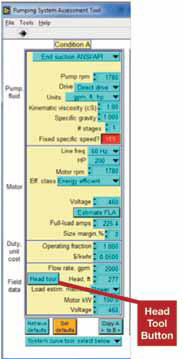
Figure 1. PSAT input area
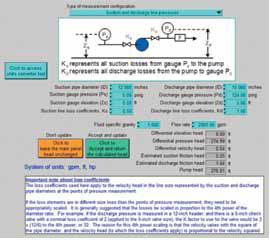
Figure 2. Head calculation tool for suction and discharge pressures
To run PSAT, the user enters information about the pump and the motor driving it in the PSAT input area (Figure 2). The box at the bottom of the column is where the flow head and input power data taken during testing is entered. The user can calculate the total head of the pump by hand, or it can be calculated by the PSAT by clicking the blue “Head tool” button next to the input box. This brings up a calculator where you input your system and measured data. The tool will calculate the total head (Figure 3). If you have a system without a suction pressure gauge, the tool can also calculate the total head by selecting “suction tank elevation, gas space pressure and discharge line pressure”.
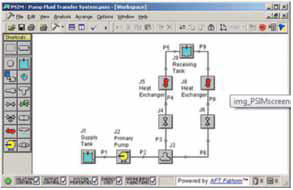
Figure 3. Free PSIM system analysis tool
Use of the Information
Now that the pump's performance is known, the actual performance can be plotted on the manufacturer's performance curve. This determines if the pump is operating near its best efficiency point (BEP). If the goal is to improve the reliability of the pump, and the pump is operating far away from the BEP, this may indicate that the hydraulic loads within the pump are causing shaft deflection, seal or bearing problems, internal rubs, etc. If reliability problems exist and the pump is operating near its BEP, this may point to mechanical problems—such as poor alignment, weak base plates, improper assembly techniques, etc.
If efficiency improvement was the main goal, this information can determine if the pump is the best fit for the application. A pump running far away from its BEP will be less efficient than one running close to the BEP. The pump, control system or operating practices may need to be modified to improve the pump system's performance. Unfortunately, no single approach will improve the efficiency of every system.
Many factors need to be considered to optimize system efficiency. In some systems, the optimization may require nothing more than turning off the pump when there is no demand. In other systems, trimming the impeller to the proper size so it can meet flow and head demand will suffice. In more complex systems, the use of motor control, parallel pump systems and state of the art PLC control may be required.
If complex system changes are required, analyzing the effects of various operating conditions on a simulation tool is suggested before physical changes to the system are made. A free analysis tool (PSIM) is available on the Hydraulic Institute/Pump Systems Matter website at: http://www.pumpsystemsmatter.org/content_detail.aspx?id=110 (Figure 5).
Another powerful tool, found within PSAT, is the system curve tool. It gives a fairly accurate simple system curve for each operating condition (Figure 6). This curve generator uses the measured condition point and the zero flow static head to create a system curve showing the actual losses within the system.
This curve can be output to a spreadsheet that can be combined with multiple system curves and the pump curve to gain understanding of the operating parameters of the system.
With some fairly straightforward testing and the analysis tools shown, pump system assessment can be conducted, and the pump and systems' reliability and energy efficiency can be improved. This can have a major positive impact on the bottom-line of operations, as well as possibly helping a company meet its energy reduction goals in our increasingly energy-aware society.
Additional Resources
A new ASME standard for conducting pump system energy assessments is available at the website below:
Additionally there is a free awareness seminar to help users understand the content of the standard and webinar dates and times are available at:
http://www.pumpsystemsmatter.org/content_detail.aspx?id=5685
Pumps & Systems, December 2010