Pumps & Systems, January 2009
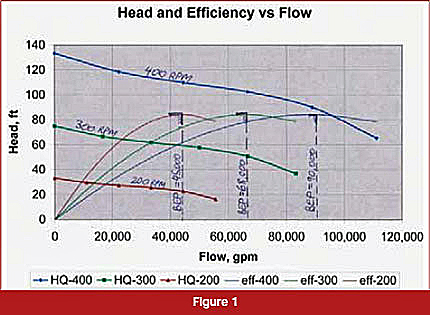
If your immediate answer was yes, think again-you might be surprised. Sometimes running pumps faster can actually help avoid cavitation. How so? We need to first consider the affinity laws. As far as pump performance, the flow scales up or down directly with speed ratio and the head as a square of that ratio (see Figure 1). At 400-rpm, a pump's BEP is at 90,000-gpm, and head is at about 64-ft. As RPM drops in half, BEP flow halves as well (45,000-gpm), and head is reduced to (200/400)2 = 0.25 x 84 = 21 feet. In between, 300-rpm, there is a similar relationship. So far, nothing spectacular.
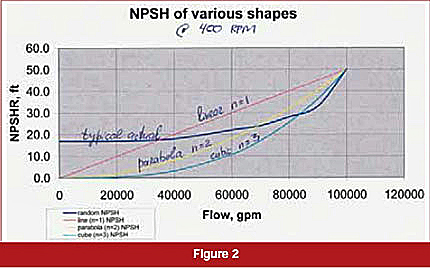
The NPSHR curve scales similarly to head, i.e., as a square of the speed RPM ratio. For most pumps, the NPSHR curve stays mostly flat at low flow, then begins to slowly rise toward the BEP flow, and increases quickly past the BEP. It is difficult to mathematically describe the formula for the NPSHR curve. Figure 2 shows four different possible shapes for the NPSHR curve: linear (gradually and uniformly rising from zero toward higher flow, H=aQn, n=1), as a basic second order parabola (n=2), a third order cubic parabola (n=3) and a typical actual shape, which is a combination of all three, depending on which part of the flow segment (low flow, BEP region and past the BEP) under consideration.
If NPSHR versus flow was linear, then applying the affinity laws to the NPSHR curve would scale down flow (directly with RPM) and NPSHR (as a square of RPM), such that a lower speed NPSHR curve would sit completely below higher speed curves (see Figure 3). Just as the BEP point would move to lower flow and lower heads, so a BEP point on the NPSHR curve would move to lower flow and lower NPSHR.
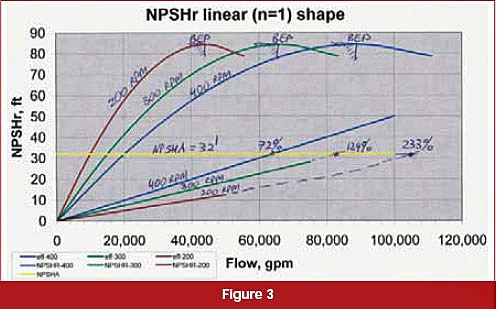
However, for a given value of the available NPSHA (32-ft in our example), a lower speed NPSHR curve would intersect the NPSHA line at a proportionally higher (percentage of corresponding BEP) flow. For example, this pump would run out only to 72 percent of the BEP flow at 400-rpm, 124 percent flow at 300-rpm and 233 percent flow at 200-rpm.
If the actual pump had such a linear shaped NPSHR curve with flow, then running the pump slower, against a given limitation of the NPSHA, would indeed help a cavitation problem. At 400-rpm the pump could run out to 65,000-gpm, but at 200-rpm it runs out to 105,000-gpm, which is probably what you intuitively thought when you answered "yes" to the question at the beginning of the article.
Unfortunately, this is not how actual pumps behave as far as the shape of their NPSHR curves.
Consider one more example in which NPSHR is not a linear function of flow, but a regular parabola (n=2), as shown in Figure 4. Here, the NPSHR curve does not change with speed at all, because the affinity laws (quadratic in nature) reduce the flow and head curve at the same rate as the NPSHR curve points scale down.
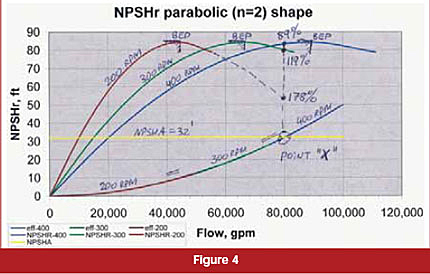
Now, point X (running out of NPSHA) is at the same flow (80,000-gpm), but it is 89 percent of the BEP at 400-rpm, 119 percent of the BEP at 300-rpm and 178 percent of the BEP at 200-rpm. Now, running pumps slower or faster does not change things-either way, 80,000-gpm is the limit, beyond which we run out of NPSHA at any speed.
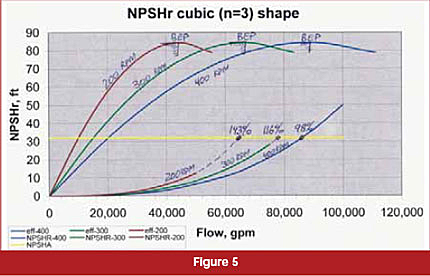
But, what if NPSHR rises much faster as compared to the scaling of flow and NPSHR points in the affinity laws? In Figure 5, 400-rpm allows us to run out to 98 percent of the BEP flow, to about 86,000-gpm. At a lower speed (200-rpm), we can only run out to 65,000-gpm, which is 143 percent of the BEP at low speed.
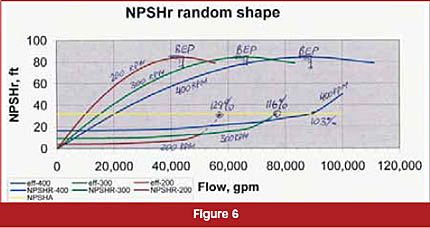
The actual pump NPSHR curves behave closer to the cubic parabola, and rise even faster beyond the BEP, a phenomenon called NPSHR stonewalling (see Figure 6). Here, a faster running pump allows flow to roughly 95,000-gpm (103 percent of BEP flow at that speed), while at 200-rpm it will cavitate even below 60,000-gpm, 129 percent of the 200-rpm flow. Thus, if a 80,000-gpm flow was desired, speeding the pump up to 400-rpm will help. At 200-rpm, or even 300-rpm, it will cause cavitation.
Surprised? Well, the answer to this counterintuitive behavior is in the shape of the NPSHR curve past the BEP point. So, why does NPSHR stonewall past the BEP, but is relatively well behaved, even flat, below the BEP? We will answer this question next time.
A parting quiz: is the NPSHR curve truly flat below the BEP flow? The first person to answer correctly will win a free admission pass to the next Pump School session.