Three common methods for analyzing payback or return on capital investments for enhancing a sealing systems' mean time before repair (MTBR) and energy efficiency are:
Net Present Value—NPV is defined as the total present value (PV) of a time series of cash flows. It is a standard method for using the time value of money to appraise long-term projects. Used for capital budgeting and widely throughout economics, it measures the excess or shortfall of cash flows in present value terms, once financing charges are met.
A net present value analysis will show the current value (in today's dollars) of an investment that will provide a return over time after applying a discount rate to the future returns (cash flows) for the use of the money (time value of money) and the project risk. The higher the net present value, the more valuable the project.
Internal Rate of Return—IRR is the annualized effective compounded return rate that can be earned on the invested capital (the yield on the investment). Put another way, the internal rate of return for an investment is the discount rate that makes the net present value of the investment's income stream total zero.
The internal rate of return will show the annualized rate of return generated over time by the project. In general, many think that a project with the highest IRR should be the highest priority project. That is not necessarily the case since the IRR method does not consider the scale of the project. It also that assumes that the cash flow from the project will be invested in other projects with equal rates of return. However, it is a widely used and accepted method for evaluating capital projects.
Simple Payback—SPB determines the payback period or the time taken for the cash inflows from a capital investment project to equal the cash outflows, usually expressed in years. When deciding between two or more competing projects, the usual decision is to accept the one with the shortest payback. SPB is often used as a first screening method. This means that when a capital investment project is considered, the first question is: How long will it take to pay back the cost? The company might have a target payback period, and so it would reject a capital project unless its payback period was less than the targeted period.
The payback period has the advantage of being simple and well understood by all management staff as it simply calculates how long it will take for the cash flow or savings generated by the project to pay back the cost. The disadvantage is that this method does not account for the time value of money. Nor does it consider the timing of cash flows, so it does not recognize the benefits of cash flows that occur after the payback period. Therefore, this method cannot distinguish between projects with equal payback periods.
Cost of Capital
An important financial consideration when discussing the payback on an investment for enhancing MTBR is the cost of capital. It is not unusual for companies using their weighted average cost of capital (WACC) as a discount rate or hurdle rate in their payback evaluation of capital expenditures. In some cases, companies will use their WACC and a risk factor as a discount rate or hurdle rate.
The WACC is considered by many companies to be the cost of money in which a capital investment is necessary to achieve an improvement in MTBR. Before proposing an MTBR enhancement project that will require capital expenditure (CAPEX), the discount rate or hurdle rate that your company uses in its evaluation of capital expenditures must be determined.
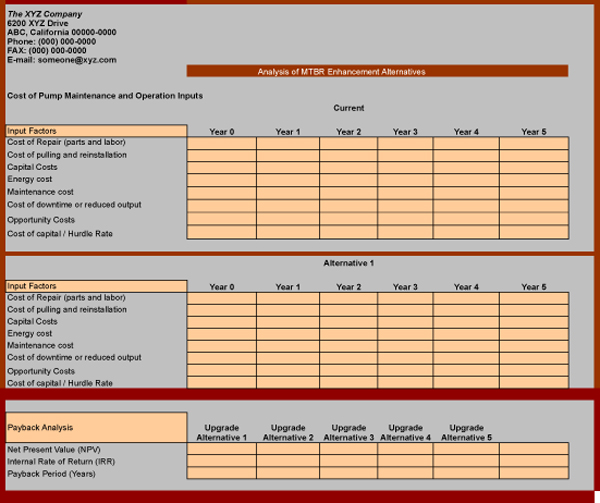
Figure 1. Payback analysis model
Calculating Payback
Figure 1 shows a sample of a payback analysis model that includes the specific inputs that would enable the user to perform a payback analysis.
In most real-world situations, you will not have all the information for all the categories shown in Figure 1, but this shows the type and scope of information that would be useful when evaluating the payback on a capital investment to enhance MTBR and energy efficiency.
Analysis Method
The first step to a financial analysis on the benefits of a capital expenditure to enhance a sealing system's MTBR and energy efficiency is to input the costs for the current situation. Since complete information often will not be available, the analysis will necessarily be based on the available data or supplemented with documented reasonable assumptions.
The second step is to input the CAPEX required to achieve the enhancement in the MTBR. The CAPEX is treated as a cash expenditure incurred in year zero when doing NPV and IRR calculations.
The third step is to enter the expected operating costs after the improvements have been made to enhance the MTBR and/or energy efficiency and to net those costs against the costs for the current situation. The resulting savings are the cash inflows that provide a payback on the invested capital. It is important to show the years in which those savings will occur to properly calculate NPV and IRR.
The final step is to run the calculations for NPV, IRR and the payback period using the CAPEX as a negative input in year zero, the cost of capital as the discount rate and the cost savings for each year over a period of time as the positive cash flows generated as a result of the investment. Typical time periods would be five to ten years. With these inputs, it is quite easy to use the NPV and IRR formulas available in Microsoft Excel. The calculations can be done by hand, but this can be quite cumbersome.
Conclusion
Justification of any sealing system improvement project requires a basic understanding of financial measurement tools to effectively determine and communicate which will provide the best return. The model presented will enable evaluation of capital expenditure to improve MTBR and energy efficiency through several alternative analyses and help identify the project with the best financial payback.
The SPB is useful for preliminary screening with limitations, while NPV and IRR allow for more realistic life cycle cost (LCC) analysis. The FSA/ESA Life Cycle Cost Estimator is a helpful tool that determines the effect of energy costs and MTBR on the LCC of alternative sealing systems. It is designed to show a relative comparison between the LCC of alternatives but is not intended to be a payback analysis tool. It is available on the FSA website, www.fluidsealing.com.
Next Month: How is gasket stress defined in industry?
We invite your questions on sealing issues and will provide best effort answers based on FSA publications. Please direct your questions to: sealingsensequestions@fluidsealing.com.