
After reading two of my articles on power pump valves, valve springs and net positive suction head required (NPSHR), Brazilian engineer Ricardo Martuscelli emailed me to suggest that I create graphs that illustrate the effects of speed (rpm) and the density of the pumpage on the NPSH requirements of these machines. That sounded like a good idea. We had the published NPSHR curves (see Figure 2), which were based on tests, but I had not used my equations to calculate equivalent curves. Could my equations produce such curves? If so, how would the calculated curves compare to the published curves? Could we include the effect of the density (specific gravity) of the pumpage in this exercise?
The equations did produce curves, which answered both questions, and are of sufficient interest, I think, to share in this article.
The following is the nomenclature used in the calculations:
As = Flow area through valve seat (wings & webs are ignored), ft2 (m2) = (π/4)(D32 – D22)
A2 = Valve area acted on by P2, ft2 (m2) = (π/4) (D32 – D12) = A4 – A3
A3 = Seating surface area exposed to P3, ft2 (m2) = (π/4) (D42 – D32)
A4 = Area of top of valve (that was exposed to P4), ft2 (m2) = (π/4) (D42 – D12)
C = Orifice coefficient of valve “escape” area
Dp = Diameter of plunger or piston, ft (m)
D1 = Diameter of hole in center of valve disc, ft (m)
D2 = OD of inner seating surface, ft (m) (ID of port opening in seat)
D3 = ID of outer seating surface, ft (m) (OD of port opening in seat)
D4 = OD of valve outer seating surface, ft (m)
Fo = Force from spring(s) when valve is closed, lb (N)
g = Acceleration of gravity, 32.2 ft/sec2 (9.8 m/sec2)
Kc = Clinging coefficient
for an OD flow valve = ((D4/D3)2 + (D3/D4)2 – 2) / 8π(sinα)2
for an ID flow valve = (2 – (D2/D1)2 – (D1/D2)2) / 8π(sinα)2
Ki = Coefficient of inertial impact of pumpage on upstream side of valve
LS = Stroke length of plunger, ft (m)
L90 = The lift of the valve at about 90 degrees of crank otation, ft (m)
N = Rotative speed of pump crankshaft, rev/min
NPSHR = Net positive suction head required to prevent cavitation across the valve, lb/ft2 (Pa)
P1 = Stagnation pressure upstream of valve assembly, lb/ft2 (Pa)
P2 = Static pressure acting on upstream disc area A2, lb/ft2 (Pa) = P1 – ρ(VS)2 / 2
Q1 = Flow rate created by plunger at mid stroke (the peak) = Q90, assuming pure sinusoidal movement of plunger, ft3/sec (m3/s) = π2NLsDP2/240
R = Spring rate, lb/ft (N/m)
VS = Velocity of pumpage moving through seat, ft/sec (m/s) = (Q2)/(AS)
W1 = Weight of valve (in air), lb (N)
W2 = Weight of the valve if axis is vertical, minus the buoyant effect of the pumpage, lb (N) = W1(1 – W3 / W4) (if axis is horizontal, W2 = 0)
W3 = Specific weight of pumpage, lb/ft3 (N/m3) = ρg
W4 = Specific weight of the valve, lb/ft3 (N/m3)
α = Angle between valve seating surface and valve axis, degrees
ρ = Density of pumpage, slugs/ft3 (lb-s2/ft4) (kg/m3) = W3/g
ω = Angular velocity of pump crankshaft, radians/sec = πN/30
The following equations were incorporated into a computer program, which used Equations 1, 2 and 3 (from Reference 2) to calculate the maximum lift of the valve (at mid-stroke) for each speed, then Equation 4 to calculate the pressure drop across the valve (NPSHR). This pressure drop was then plotted as a function of the pump rotative speed. The equations assume fully turbulent flow through the valve “escape” area (the flow area between the seating surfaces). They do not compensate for viscous liquids.
(1) L90 = (A/B)0.5
Where:
(2) A = ρQ12[A2/2(cπD3 sinα)2 – KC]
(3) B = ρQ12(A2/2AS – Ki)/AS + F0 + W2 + L90 [R – W1 (πN/30)2/g]
Because L90 appears on both sides of the equation, iteration is required for a solution. A trial value is plugged into the right side of the equation for a first trial solution.
(4) NPSHR = ρ(Q1/cπD3L9Osin α)2 / 2
Figure 1 is a cross-sectional drawing of the 3-inch-stroke triplex pump for which these calculations were performed. The pressure losses from the suction nozzle to the valve, through the valve seat, and from the valve to the plunger are minimal. Therefore, the pressure drop across the seating surfaces of the valve and seat of the suction valve represent the NPSHR of the pump. In this pump, the valve lift is limited to 0.282 inches by a stop.
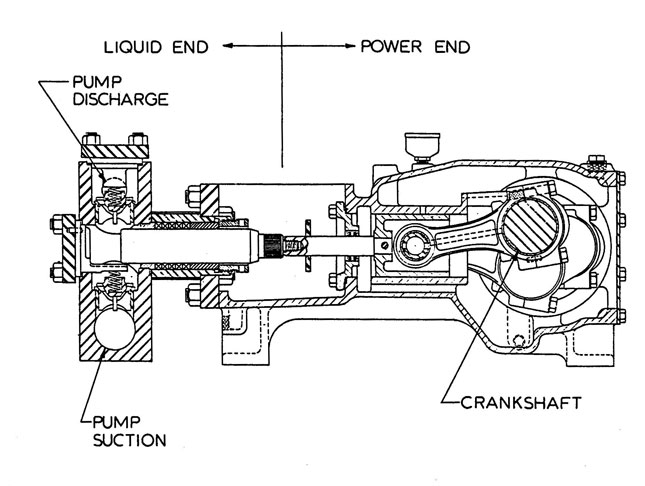 Figure 1. A 3-inch stroke, triplex power pump drawing showing the springs
on both valves
Figure 1. A 3-inch stroke, triplex power pump drawing showing the springs
on both valves Figure 2. A plot of calculated NPSHR compared to the published curve (for cool water)
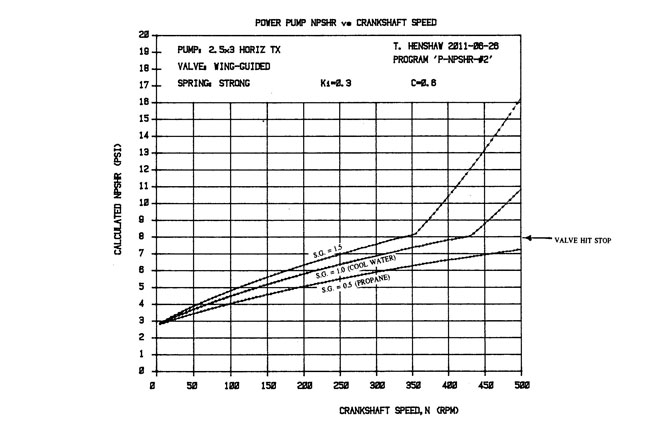 Figure 3. A plot of calculated NPSHR values for liquids with specific gravities of 0.5, 1 and 1.5
References
12/29/2012
