The Jordan, Knauff & Company (JKC) Valve Stock Index was up 27.2 percent during the last 12 months, above the broader S&P 500 Index which was up 22.6 percent. The JKC Pump Stock Index was up 26.3 percent for the same time period.1
According to the Institute for Supply Management (ISM) manufacturing activity made a sharp and prominent jump in July. The ISM’s Purchasing Managers’ Index (PMI) registered 55.4 percent, an increase of 4.5 percentage points from June’s level. July’s PMI reading was the highest of 2013, indicating expansion in the manufacturing sector for the second consecutive month. The Production Index increased by 11.6 percentage points to 65 percent. The Employment Index registered 54.4 percent showing an increase of 5.7 percent compared to June. Comments from the survey indicated stable demand and slowly improving business conditions. The July PMI was higher than expected and is a sign that manufacturing sales and production have picked up this summer, recovering somewhat from the weaknesses seen in the spring. The pace of new orders rose from 51.9 percent to 58.3 percent with a slight decrease in international sales. The overall report was positive for manufacturers (where the market has been disappointing for the past year) and shows that the third quarter began on a positive note for manufacturing.
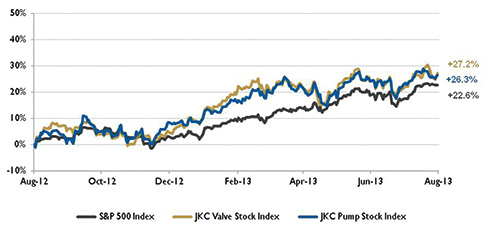 Figure 1. Stock indices from August 1, 2012, to July 31, 2013. Source: Capital IQ and JKC research. Local currency converted to USD using historical spot rates. The JKC Pump and Valve Stock Indices include a select list of publicly-traded companies involved in the pump and valve industries weighted by market capitalization.
The U.S. Energy Information Administration (EIA) estimates that global liquid fuels production outpaced consumption in the second quarter of 2013 with an average global liquid fuel stock buildup of 260,000 barrels per day (bpd) compared to an average second quarter stock withdrawal of about 210,000 bpd more than the previous four years. Total world crude oil and liquid fuels consumption increased by 390,000 bpd from the first quarter to the second quarter of 2013, reaching 89.5 million bpd. The EIA expects the annual average total world consumption to increase by 1.1 million bpd in 2013 and by 1.2 million bpd in 2014. U.S. crude oil production increased to an average of 7.5 million bpd in July, the highest monthly production level since 1991. The EIA forecasts that the U.S.’s total crude oil production will average about 7.4 million bpd in 2013 and 8.2 million bpd in 2014.
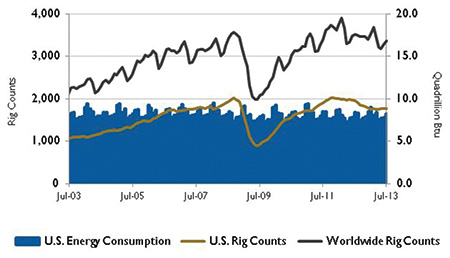 Figure 2. U.S. Energy consumption and rig counts. Source: U.S. Energy Information Administration and Baker Hughes Inc.
On Wall Street, The Dow Jones Industrial Average was up 4.0 percent for July, its seventh month of increases in the past eight months. The S&P 500 Index was up 4.9 percent and the NASDAQ Composite Index gained 6.6 percent for the month. The Federal Reserve stated that it would continue its stimulus efforts because of continued modest economic growth, higher mortgage rates and low inflation. Reports on second quarter economic growth and private sector job growth in July helped ease investor concerns over the state of the economy. P&S
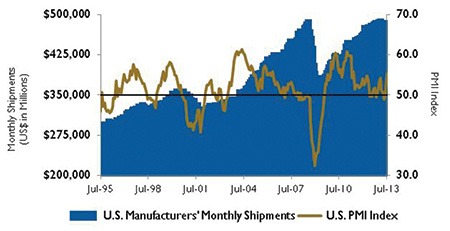 Figure 3. U.S. PMI index and manufacturing shipments. Source: Institute for Supply Management Manufacturing Report on Business® and U.S. Census Bureau.
Reference 1. The S&P Return figures are provided by Capital IQ.