


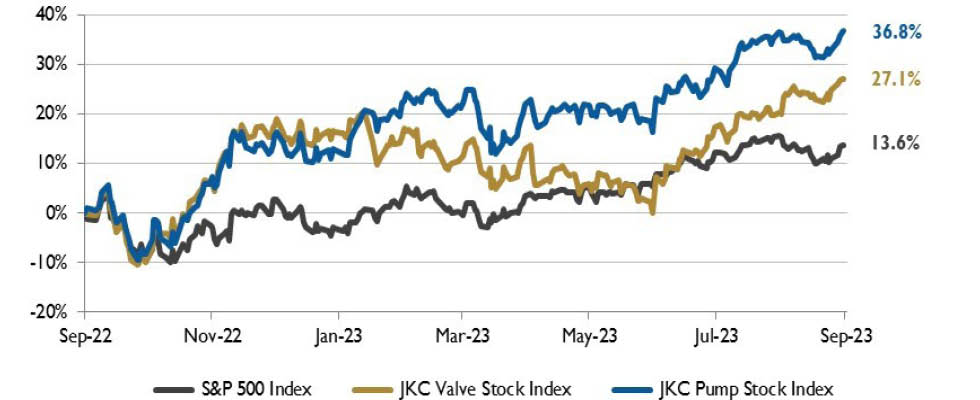
The Jordan Knauff & Company (JKC) Valve Stock Index was up 27.1% over the last 12 months, while the broader S&P 500 index was up 13.6%. The JKC pump stock index gained 36.8% for the same period.1
The Institute for Supply Management’s Purchasing Managers Index (PMI) registered 47.6%, 1.2 percentage points higher than the July reading, a continuation of a downward trend that began in June 2022. This is reflected in the PMI’s 12-month average falling to 47.8%. In addition, for a third straight month, none of the ten subindexes were above 50%. The five manufacturing industries that reported overall growth were: printing and related support activities; transportation equipment; food, beverage and tobacco products; petroleum and coal products; and miscellaneous manufacturing.
The New Orders Index contracted for the 12th consecutive month, registering 46.8%, a decrease of 0.5 percentage points compared to July. Only one (transportation equipment) of the six largest manufacturing sectors reported increased new orders. The four industries that reported new order growth were: nonmetallic mineral products, textile mills, paper products and transportation equipment.
The U.S. Department of Labor reported payrolls increased 187,000 in August, while the unemployment rate rose to 3.8%. Over the past six months, monthly payroll gains averaged 194,000 compared to 321,000 the prior six months. While slowing, the current rate remains elevated relative to the 177,000 pace that was seen from 2018-2019, prior to the pandemic.
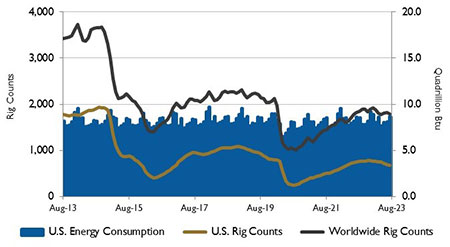
Source: U.S. Energy Information Administration and Baker
Hughes Inc.
According to Baker Hughes, 520 oil-directed rigs were active in the United States during the week of August 18, 2023, an 81-rig decrease compared with the same week last year. However, increased well productivity has offset the decline in active rigs so far in 2023. Even though rig counts have fallen, U.S. crude oil production is forecast to increase. In 2024, the number of active rigs is expected to increase, helping to grow crude oil production in the second half of the year. According to the U.S. Energy Information Administration, crude oil production in the Lower 48 in the second half of 2023 is forecast to average 10.6 million barrels per day (b/d), up 360,000 b/d from the July forecast. The forecast for crude oil production for 2024 was increased by 240,000 b/d to 10.8 million b/d.
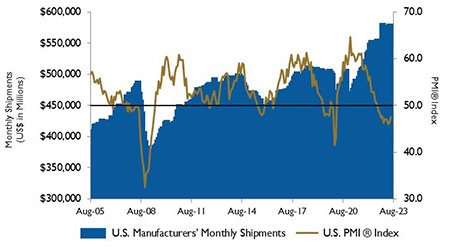
Source: Institute for Supply Management Manufacturing Report
on Business and U.S. Census Bureau
On Wall Street for the month of August, the Dow Jones Industrial Average fell 2.4% and the S&P 500 Index declined 1.8%, its first monthly loss since February. The Nasdaq Composite lost 2.2%, its largest loss this year. Markets remained volatile throughout the month. The personal consumption expenditure (PCE) index reading showed that the cost of goods and services increased 0.2% in July on a month-over-month basis.
Reference
The S&P Return figures are provided by Capital IQ.
These materials were prepared for informational purposes from sources that are believed to be reliable but which could change without notice. Jordan, Knauff & Company and Pumps & Systems shall not in any way be liable for claims relating to these materials and makes no warranties, express or implied, or representations as to their accuracy or completeness or for errors or omissions contained herein. This information is not intended to be construed as tax, legal or investment advice. These materials do not constitute an offer to buy or sell any financial security or participate in any investment offering or deployment of capital.