


My June Pumps & Systems article focused on the value of conducting regular performance testing. In August, I discussed pump cavitation and how to recognize the problem. In both articles, calculational templates were provided to help in the decision-making process.
This month, I am going to introduce a technology that offers new insights into the performance of specific pumps and their interactions with the other system elements. The digital twin, which I will discuss in detail, uses real-time operating data to determine pump health and its goal is to substantially improve the effectiveness of maintenance processes.
We will see how to use the digital twin to provide a clear picture of pump operations. We will discuss how it uses data supplied by the installed plant instrumentation to reveal how the pump operates within the system, and how to use this insight to improve maintenance efforts. But let us start by reviewing typical maintenance objectives.
Maintenance Scenarios, From Worst-Case to Best
If a component of a system is not operating properly, the first order of business is clear: Return the system to safe and uninterrupted operation as soon as possible.
For example, if an installed pump is unable to meet the system’s pumping requirements, the immediate action to take is to start up a standby pump and keep the process operating. The next step is to troubleshoot the problem by evaluating the interaction of the pump, process and control elements. Then put the malfunctioning pump on a maintenance schedule and ensure that necessary corrections take place. This is corrective maintenance, and it is a reactive process.
However, the goal of a maintenance program should be to proactively determine when an item of equipment should be evaluated before a failure occurs that places system operations in jeopardy. That is the typical role of the maintenance department, but the job of keeping equipment and the system running optimally is a team effort. I will demonstrate with a pump example.
In a pump maintenance check, manufacturers are a valuable resource. They are the experts on how their pumps are designed and built. They can apply all the feedback they have gotten from the experiences of other customers who use similar pumps. They also collaborate through industry associations, like the Hydraulic Institute (HI) and Europump, to develop standards that offer guidelines for pump operation.
With this knowledge, these manufacturers document their maintenance recommendations in an operations and maintenance (O&M) manual and prescribe the optimum maintenance scheduling frequency. Their recommendations often are based on their experiences with pumps operated in the worst-case conditions.
Using the input from the manufacturer’s O&M manual, the maintenance department determines a schedule based on the pump’s local conditions. Items such as operation schedule, the duration of planned maintenance outages, the pump’s maintenance history, the length of time needed to perform an inspection, the severity of the disruption if the pump were to fail, and other factors, can influence the decision. After pump checks and frequency are determined, inspection is added to the schedule. Most facilities use maintenance management software to help document and schedule the maintenance process.
TDM, CDM & PDM
The maintenance process information allows the scheduling of inspections during a planned outage to discover and fix the problem before it can impact system uptime. This is referred to as time directed maintenance (TDM). It is relatively easy to implement—all you need is a list of pumps, the items to be checked and a calendar. The downside is that TDM does not consider the pump’s actual operating conditions. As a result, some pumps will be checked more often than needed, and some will fail before they are checked.
By factoring in the pump location, its hours of operations, the flow rate, the application severity and the maintenance history, the period of inspections can be based on the pump’s actual operating conditions. This is condition directed maintenance (CDM). This process requires more record-keeping, but the interval between maintenance checks can be safely increased based on actual conditions.
The gold standard is predictive directed maintenance (PDM). It is based on conducting surveillance testing under given system operation conditions and comparing the test results with the surveillance test procedure. PDM requires more testing and the need to place the system into a specific test lineup. This type of testing is often performed on safety-related piping systems in nuclear power plants, and it is also often limited to systems where failure is not an option.
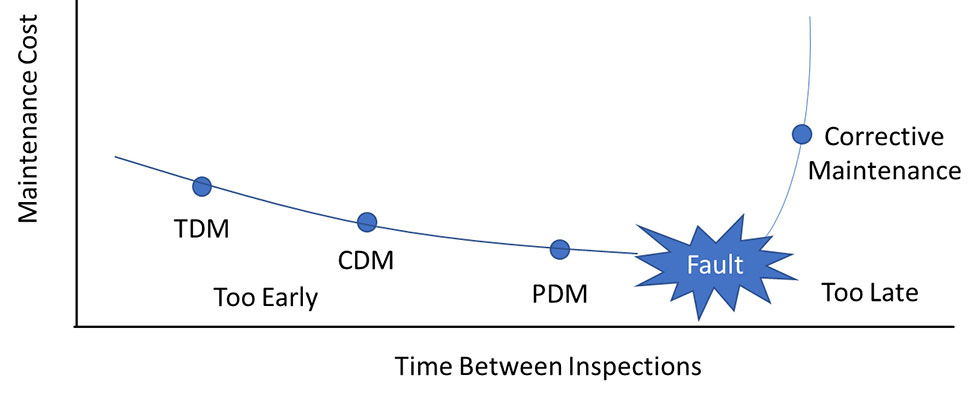 IMAGE 1: Maintenance cost for a single pump based on the maintenance method employed. If done too often, more time is consumed in outages. If done too late, it could affect plant operations. (Image courtesy of the author)
The Real-Time Impact of the Digital Twin on PDM
With the advent of digital twin technology, autonomous surveillance testing can identify equipment that is not operating within the equipment’s parameters. This allows more equipment inspections based on PDM—but without the need to develop or deploy surveillance tests that hinder operational requirements.
The digital twin is more than a software program, a CAD drawing or an equipment database. It is a computer simulation of a physical system consisting of four major elements:
- A mathematical model used to describe the system
- Data that describe the equipment found in these systems
- Actual operating data to provide details on system operations
- A method to analyze the data to gain insight into the operation of the physical piping system
As examples of how a digital twin works for pump operations, here are examples that I presented in my last two Pumps & Systems articles. I will discuss how to use the results to gain insights on pump operations and how this can be used in a PDM program.
The focus of the “Are You Looking for Trouble?” article was on conducting pump performance testing within an operating system. In it, the testing template provided the mathematical model (1) used to describe the system. The manufacturer-supplied pump test curve delivered the data on the equipment and its operation (2). The plant’s operating data (3) was used to conduct the performance test as identified in the template. The final results provided a method to determine if the physical system was operating within the pump’s prescribed performance goals (4).
August’s article, “How to Take a Proactive Approach to an Insidious Problem,” focused on how to determine if a pump is cavitating. The net positive suction head available (NPSHa) calculation described the mathematical model (1). The pump curve, suction piping and supply tank provides the data to describe pump operation (2). The plant operating data (3) was used to conduct the calculations as identified in the template. The final results (4) provided the comparison of the system NPSHa data with the manufacturer’s supplied net positive suction head required (NPSHr) requirement.
In our example, we performed two tests to determine pump health using the installed instrumentation without having to alter the system’s operations. These tests required manually collecting the data, reviewing the pump curve, performing the calculations and comparing the observed results to the published test curve.
Low-Impact Surveillance Testing
Digital twin technology allows us to perform multiple calculations to determine pump health in real time and tie the resulting insights into the other mission-critical applications found in many operating facilities. This enables autonomous surveillance testing to identify equipment that is not operating within equipment guidelines and parameters. Using the insight from the digital twin, we can conduct predictive directed maintenance on pumps and other operating equipment at a relatively lower impact to productivity and uptime.
The key is to perform the pump test on an ongoing basis, which provides insights that determine the condition of pump operations over an extended period.
Most commercially available piping simulation software can model system operation when provided with a set of operating conditions. The simulation software provides the mathematical model (element 1) to describe the process, along with the ability to enter the as-built operating data for each element in the system (element 2). By entering system as-operated data—tank levels, the position of isolation valves, the status of pump operation, control setpoints, etc.—the software can simulate system operations. As we have seen in previous articles, this provides a wealth of information based on the calculated results.
The accuracy of the calculated results is a function of the as-built and as-operated data. The results of the calculations can be validated by comparing observed values of the physical system with the calculated results of the model. To demonstrate, if the observed pump discharge pressure of the physical system matches the calculated value of the pump discharge pressure, the results are valid.
If those results are valid, then the accuracy of all model results can be considered accurate. If other operating data is available from physical, installed instrumentation (such as pump suction pressure or flow rate), the comparison of those values to the calculated results provide further evidence of the accuracy for the model.
Acting on the Insight
Digital twin technology can take us one step further by automating element 3, the input of operational data.
If the piping simulation software has an application programming interface (API), it can import the plant’s operating data from the facility’s data logger (via its API) to set up the model using current as-operating data. This allows the program to automatically calculate all the defined system parameters, including the pump surveillance and NPSH tests previously outlined.
HI has a variety of standards, including American National Standards Institute (ANSI)/HI 9.6.1-2017, that provide guidelines for the NPSH margin ratio to avoid pump cavitation, along with a suggested margin ration for pump cavitation; and ANSI/HI 9.6.3-2017, with guidelines for continued flow through a pump based on its best efficiency point (BEP). Based on a specific pump’s operating experiences, users can insert their own local guidelines.
The results of the simulation software indicate when any guidelines are exceeded based on current operating conditions. Using the API, the software can send results to other mission-critical applications used to operate and maintain the facility’s assets.
Sending the calculated result to the facility’s maintenance management application is a major step toward implementing PDM and achieving the objective of increased system uptime while minimizing maintenance costs.
In my upcoming book, “Digital Twin: The Future of Fluid Piping System Management,” I discuss how this new technology provides greater insight throughout the project life cycle management from the design built, to the operate and maintain phases.
To read more Pump System Improvement columns, click here.