


Vibration is one of the most common measurements taken on pumps and drivers to assess the operation and condition of the equipment. A few of the reasons to measure pump vibration are:
- initial acceptance and commissioning tests
- trending and analysis used for predictive maintenance
- to troubleshoot vibration and noise
- to monitor the health of the machine
- to extend the life of the equipment
- to prevent unexpected or catastrophic failures
If a user experiences a high vibration issue, they will likely have questions. For example: Is it too high? Has or will damage occur? How do I figure out the cause? These are all logical questions, but the answer is likely complicated and requires an understanding of vibration principles, pump design, pump generated forces and dynamics, measurement techniques, instrumentation, analyzers and troubleshooting methodologies.
Pump Vibration, Units, Forced Vibration, Free Vibration & Mode Shapes
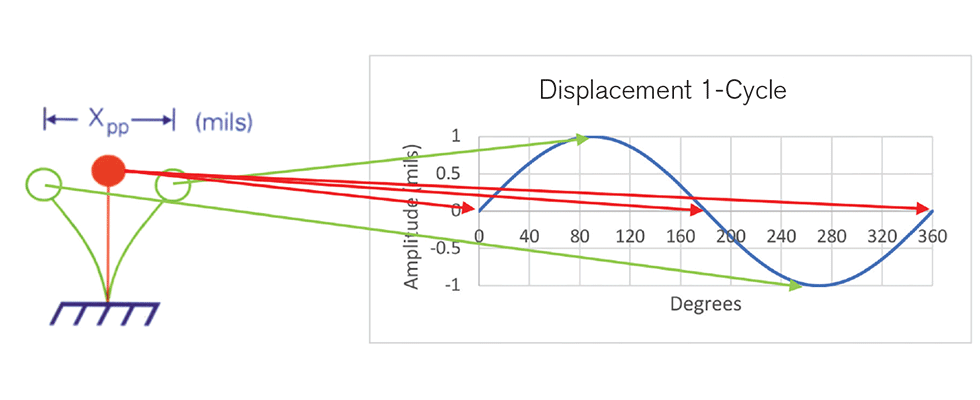
Vibration can be described as oscillatory motion of an object about its position of rest due to the relationship between a reaction force, the mass, damping and stiffness. Image 1 illustrates this oscillatory motion and points out that vibration is telling us how much the part is moving or displacing. At the starting point (red), the object is at zero amplitude. When it has moved 90 degrees (full to right), it has moved 1 mil. It then oscillates back, crossing the zero point (red) at 180 degrees, moving to -1 mil at 270 degrees (full to left) and then back to the zero point to complete one cycle. It is common to measure this movement in peak-to-peak (pp) displacement, which is 2 mils pp in this case.
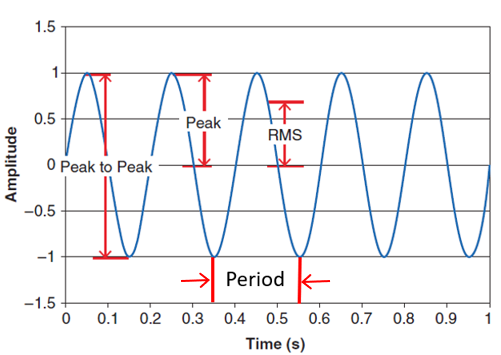
The illustration in Image 1 is simplified, only considering a single cycle of free vibration. The frequency depends on the amount of time it takes to complete the cycle. For example, if this oscillatory cycle occurred 10 times per second, the frequency would be 10 Hertz (Hz) or 600 cycles per minute (cpm). The period of time it takes for one cycle to be completed is the inverse of the frequency or one tenth of a second for the 10 Hz example. This example has units of mils pp, which is a common way to present displacement amplitudes. Image 2 illustrates what is meant by pp but also illustrates that units can be communicated as zero to peak (pk) and root mean square (RMS) as demonstrated. Additionally, the period of the cycle in time (T) is illustrated.
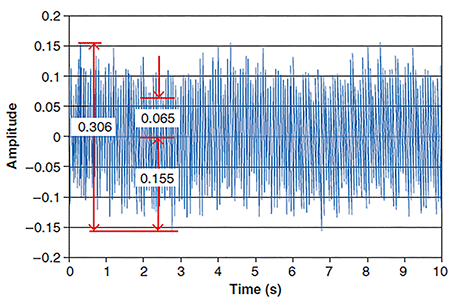
For a single frequency sign wave, as illustrated in the left figure of Image 2, pp vibration will be two times the pk, and RMS vibration will be 0.707 times the pk. However, for a time waveform that is not a single frequency, the determination of the values of pp, pk and RMS vibration will not be as straightforward but are shown as the right figure in Image 2.
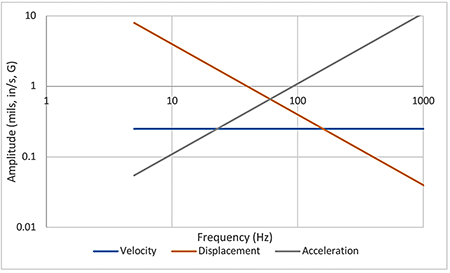
Other units of amplitude are velocity and acceleration. Velocity measures how fast the object is vibrating (inches/second), and acceleration measures the rate of change of velocity (G). Both are related to displacement, and the velocity and acceleration amplitude can be calculated from displacement based on the frequency, as illustrated in Image 3. What becomes evident is that for a constant velocity (0.250 inches/second pk), displacement is pronounced and acceleration is limited at low frequencies. Conversely, displacement is limited and acceleration is pronounced at high frequencies.
It is common to use amplitude units as follows:
- pp displacement when measuring shaft vibration or low frequency housing vibration
- RMS velocity when considering overall vibration for trending or acceptance
- G’s pk when considering damaging force levels, especially at high frequencies
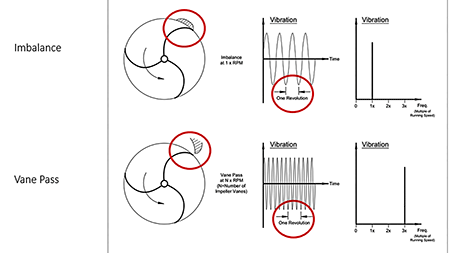
Frequency and period come into play because pump forced vibrations generally occur as a function or interval of shaft rotational speed (x). As such, the concept of free vibration and forced vibration frequencies must be understood. Forced vibration occurs due to external forces (balance, misalignment, rubbing, etc.) at specific frequencies (Image 4). Other forced vibrations that are hydraulic in nature (cavitation or recirculation) generally result in impacting and vibrations that are not tied to an integer of shaft rotational speed. Multiples or orders of these forced vibrations may show up as harmonics (for vane pass: 3x, 6x, 9x, etc.).
Free vibration is the oscillation of the system at its natural frequencies. Essentially, these are the frequencies and mode shapes that the system will vibrate when naturally excited. If we consider a vertical pump and the above ground structure, there will be a natural frequency with mode shape that represents the deflection, illustrated on the right figure of Image 5. This is the first above ground natural frequency mode and is referred to as the reed critical frequency (RCF). As noted with sections X-X and Y-Y, the RCF value will vary directionally. Note that there are additional natural frequencies and with different mode shapes that may need to be considered.
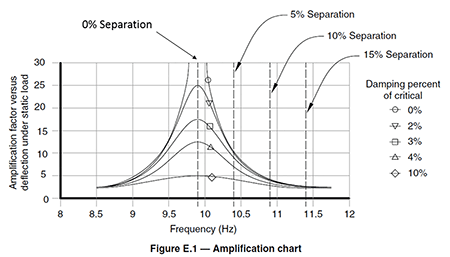
Pump forced vibration and dynamics can be complex, resulting in many different forced vibration frequencies along with the dynamics of the structure and rotor contributing to a pump’s overall vibration. A key takeaway is that when the forced vibration excitation frequency (even when the force is low) coincides with a natural frequency, a resonance condition exists, which results in amplification of the vibration. Therefore, there generally needs to be a minimum of 10% separation margin between a forced vibration and natural frequency unless sufficient damping is present to limit the amplification (Image 6). There are certain instances where resonance is more likely to occur, and it may be prudent to specify or conduct upfront dynamic analysis to limit the chance of high vibration due to resonance. Refer to American National Standards Institute (ANSI)/Hydraulic Institute (HI) 9.6.8 Rotodynamic Pumps - Guideline for Dynamics of Pumping Machinery for additional guidance and recommendations.
Looking Ahead to Part 2 – Vibration Measurement & Troubleshooting
Part 2 of this article will be published in a later edition. It will cover the measurement of pump vibration for initial acceptance, present a troubleshooting methodology of progressing complexity and provide example analyses using trending, time waveforms, frequency spectra and more.
References
Hydraulic Institute, ANSI/HI 9.6.4 Rotodynamic Pumps for Measurement and Acceptable levels, www.pumps.org
Hydraulic Institute, ANSI/HI 9.6.5 Rotodynamic Pumps Guideline for Condition Monitoring, www.pumps.org
Hydraulic Institute, ANSI/HI 9.6.8 Rotodynamic Pumps Guideline for Dynamics of Pumping Machinery, www.pumps.org
Gaydon, Claxton, Cropper, Marscher, Methods to Determine and Specify Rotodynamic Pump Dynamic Analysis, OakTrust - Texas A&M university Libraries, oaktrust.library.tamu.edu
Pump Systems Matter, Introduction to pump vibration webinar, www.training.pumps.org
Pump Systems Matter, Vibration troubleshooting webinar, www.training.pumps.org