


Second in a Series
The first part of this series (Pumps & Systems, December 2016, read it here) introduced an investigation involving three double-suction horizontal split-case pumps (labeled 2A, 2B and 2C) that have had mechanical seal issues since their installation around 2009. Of the four power generation units at East Kentucky Power, Unit 2 was the only one having these problems.
A pump reliability and efficiency measurement and data acquisition system (PREMS-2A) was installed to troubleshoot this case and track parameters related to pump reliability (vibrations, temperatures) and performance (head-capacity, power and efficiency). This part will explore data trends and analysis.
Data Trends
Because the flow was not readable by the flow meter at the time of the initial test, a simplified assumption was made regarding the pump’s actual head-capacity curve as supplied by the original equipment manufacturer (OEM).
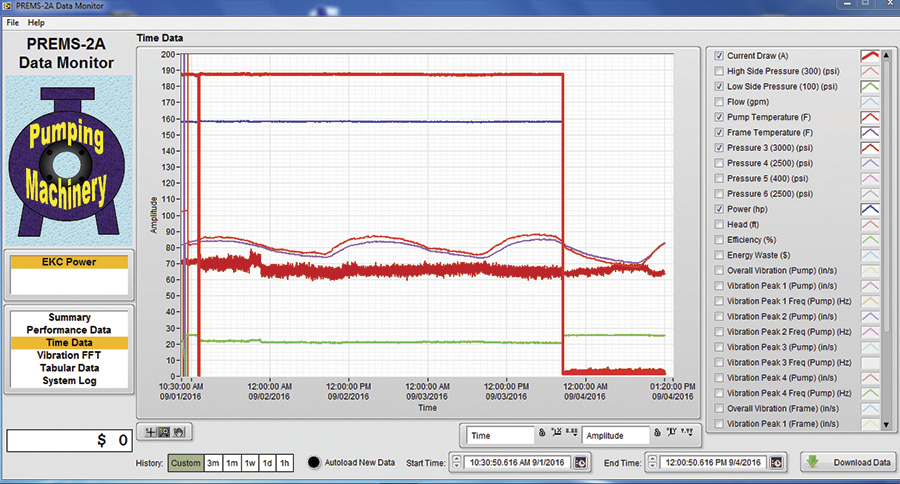 Figure 1. A screenshot of the live data from the PREMS-2A system (Graphics courtesy of the author)
As shown in Figures 1 and 2, in 16 hours (8,279 data points), the pump head varied between 88 and 131 feet—3,600 to 6,000 gallons per minute (gpm). This indicated that Pump 2A operated reasonably close to its best efficiency point (BEP), and no unusual internal flow-induced disturbances or cavitation would be expected. Pumps 2B and 2C showed similar results. Transposing the data over the OEM curve revealed the following information:
- Pump 2A generally operated between 3,600 and 6,000 gpm.
- Pump 2B operated between 4,000 and 5,500 gpm.
- Pump 2C operated between 4,000 and 5,800 gpm.
The ultrasonic flow meter’s accuracy is 8 to 10 percent, and the pitot tube is 1 to 2 percent accurate. Pitot tube meters generally read a somewhat higher (about 6 percent) flow when compared with the ultrasonic meter.
As shown in the data, the bearing housing temperature readings were not high, and they exhibited a slow-changing trend, reflecting mainly ambient temperature variations throughout the day/night—no “smoking gun.”
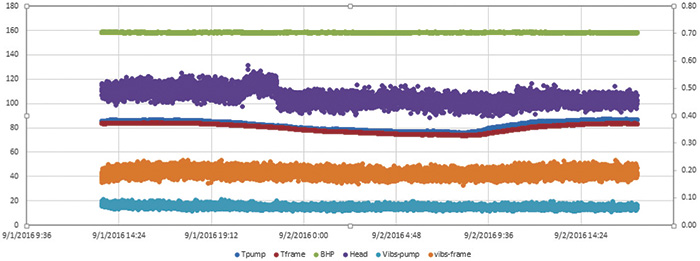 Figure 2. Expanded data plot of pump head for Pump 2A (calculated from discharge and suction pressures), temperatures, amps (left side scale) and vibrations (right side scale)
Separate Flow Test
A company that performs flow measurements obtained a flow record, from Sept. 9-16, 2016.
If the plant is running, both pumps are running; if the plant is offline for an outage, one pump runs until the turbine is cooled down (about two to three days) and then all pumps shut off during the outage. If a short-term outage takes place, one pump will run because the turbine will still be hot. Once the unit is fired back up, both pumps will be running.
During the earlier PREMS-2A tests, the team deduced the flow from the pressures, assuming non-degradation in performance. That translated to a flow range of 4,000 to 5,500 per pump. The flow-measurement company’s data, however, shows about 3,000 to 4,000 per pump when two run together, or 4,500 when one runs. This implies roughly 1,000 gpm degradation of the flow from what would be expected with the OEM curve. The company stated that its ultrasonic meter tends to read about 6 percent lower than the actual flow, which was confirmed by completing the pitot test in conjunction with the flow test. A typical 4,000 gpm reading would need to be corrected to approximately 1.06 x 4,000 = 4,240; for example, a 300 gpm correction, or a 700 gpm deficit compared with the OEM curve.
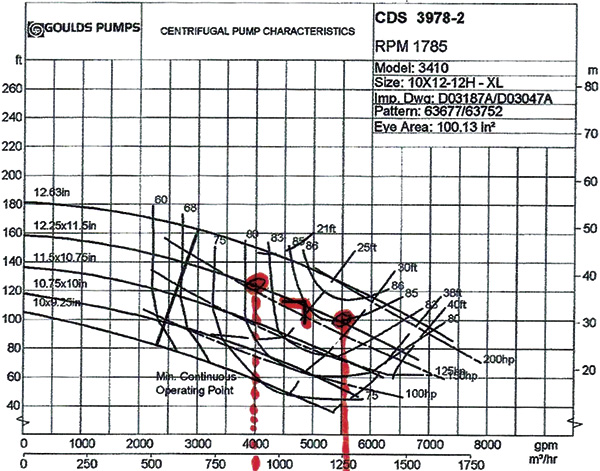 Figure 8. OEM performance curve with the actual flow operating range noted by the PREMS-2A system analysis
At roughly 140 feet of head, this equates to about $16,172 per year running nonstop at $0.10 per kilowatt-hour (kWh). Assuming two pumps run nonstop most of the time, this results in about $32,000 of wasted energy per year.
Vibration
Vibrations fluctuated between 0.15 and 0.25 inches per second (in/sec) (overall, root mean square [RMS]) for Pumps 2A and 2C in the direction along the flow axis and remained less than 0.1 in/sec in a direction perpendicular to the flow direction. Pump 2B vibrations were lower, less than 0.1 in/sec.
As a reference, 0.3 in/sec is considered a warning, and 0.5 in/sec is an alarm. The data indicated that there was no apparent vibration concern. Some changes in vibration fluctuations in Pump 2C were noted, but those levels stayed relatively low, never exceeding about 0.25 in/sec.
Vibrations also were verified manually by a hand-held Fast Fourier Transform (FFT) analyzer along the entire perimeter of each pump’s frame (each of the four sides: at the three locations along the top steel member, bottom and both sides). As would be expected, the upper member (cross bar) showed higher vibration compared with the sides or lower bars (0.08 in/sec at the upper bar, gradually reducing to 0.02 in/sec at the lower [foundation level] bar). That indicated that the structural integrity of the supporting structure was adequate.
However, a detailed (also manual) traverse of the entire pump in the axial direction (starting from the top bearing housing, moving down along the casing and eventually to the lower bearing) showed peculiar results. While vibration was low throughout the pump and bearing housing body, vibration at the lower bearing housing (Pump 2B) was drastically higher at one side (0.56 in/sec) than the other (0.11 in/sec)—essentially at the same elevation.
A speed of 1,778 revolutions per minute (rpm) represents 29.6 hertz (Hz) running speed frequency (1X). Significant vibration was present on side 1 of the lower bearing (below 15 Hz), and virtually no vibration was present on the opposite side (just a few inches away).
The structural detail of the lower bearing housing was suspected to be compromised (cracked, loose bearing fits, etc.). In this case, the hammering action of this low frequency could be a contributing factor to the seals’ compromised integrity and failures.
Pump Reassembly
The next planned step was to reassemble the pump(s) during the upcoming outage and examine them for the following:
- piping loads to make sure the pump is not warped by the piping load deflections (dial indicators are used to see how much load is on the pipe that could cause seal damage)
- seal condition, including venting arrangement (in vertical position, lack of venting may prevent air from escaping from the seal chamber; this could create air/liquid pockets and poor lubrication of the seal faces, which could lead to burn-up and failure of the seal faces)
- bearing bore dimensions and fits (outer diameter to housing)
- seal flush piping condition to confirm seal flush is active (no clogged tubing or cyclone separator malfunction/clogging)
Alternatives to Pump Repositioning
One alternative to mechanical seals is a simple packing (with possible lantern ring/flush). This arrangement may be enhanced if the packing chamber is designed to have a follow-up chamber followed by a bushing to further restrict any flow of leakage past the seals. The follow-up chamber would slowly accumulate any small leakage past the packing and, before exiting along the shaft toward the bearings, the leakage from the packings would be directed to a drain—never getting past the gland and into the bearings.
This arrangement would be simple, inexpensive and reliable. Eliminating the weakest component (seal) and replacing it with a more reliable component (packing) should be an alternative for any installation that does not require a mechanical seal.
Next Steps
Because of the team’s inability to read the flow at the initial test, they could not determine the actual degradation of efficiency. Instead, they used the original OEM curve to estimate the flow so the “deficiency” (the opposite of efficiency) impact was not calculated. Their suggestion was to follow up with this additional test after the outage, with the PREMS-2A assisted by the GE878 ultrasonic flow meter.
The next part of this series will discuss what happened: inspection findings, fixes and follow-up monitoring.
References
- L. Nelik, Pumps & Systems, July, August, September, October 2015, “Efficiency Monitoring Saves Plants Millions” – in four parts
- PREMS-2A Pumps On-Line Efficiency and Reliability Monitoring: http://www.pumpingmachinery.com/pump_school/PVA/pva.htm (model #11)
- L. Nelik, “Analysis of the Thermal Behavior in the Sealing Cavity of an Overhung API Process Pump,” Proceedings of 8th International Pump Symposium, Texas A&M, March 3-5, 1991