


The Jordan, Knauff & Company (JKC) Valve Stock Index was down 27.3 percent over the last 12 months, while the broader S&P 500 Index was down 1.3 percent. The JKC Pump Stock Index also decreased 25.8 percent for the same time period.1
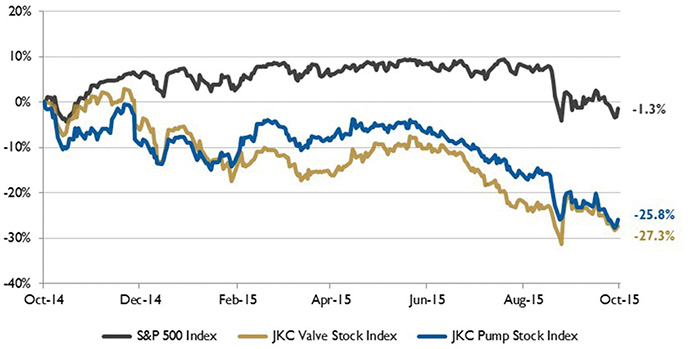 Figure 1. Stock indices from Oct. 1, 2014, to Sept. 30, 2015
Source: Capital IQ and JKC research. Local currency converted to USD using historical spot rates. The JKC Pump and Valve Stock Indices include a select list of publicly traded companies involved in the pump and valve industries weighted by market capitalization.
The Institute for Supply Management's Purchasing Managers' Index (PMI) fell to 50.2 percent for the month of September, the lowest reading since May 2013. Only seven industries reported growth in the month, the fewest in nearly three years. The New Orders Index decreased to 50.1 percent from 51.7 percent, the lowest reading since 2012, while the Production Index fell 1.8 percentage points to 51.8 percent. Survey respondents cited overseas developments as their most significant concerns, with comments such as "concerns about China downturn" and "international business trending bearish" noted in the report.
The Bureau of Labor Statistics reported that employment increased by 142,000 in September with the largest job gains occurring in health care, professional and business services, retail and information. So far this year, job growth has averaged 198,000 per month compared to an average monthly gain of 260,000 in 2014. The manufacturing sector lost 9,000 workers in September. Over the last eight months, the sector has added zero net new jobs. In the second half of 2014, manufacturers hired an average of more than 20,000 workers per month. The overall labor force participation rate fell from 62.6 percent in August to 62.4 percent in September, the lowest figure for this measure since October 1977.
Brent crude oil spot prices increased by $1 per barrel in September to a monthly average of $48 per barrel. Due to uncertainty regarding potential lower economic and oil demand growth in emerging market countries, crude oil price volatility increased significantly in August and remained high in September.
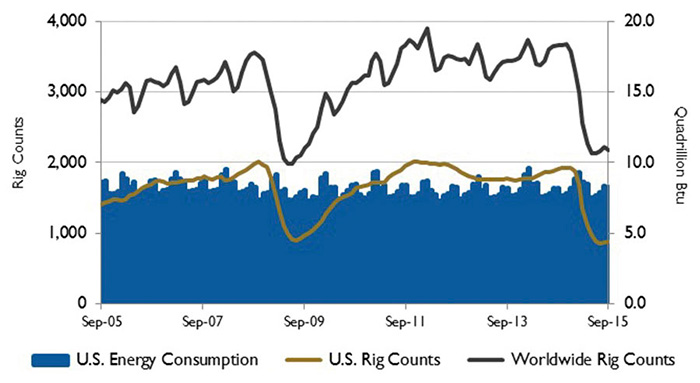 Figure 2. U.S. energy consumption and rig counts
Source: U.S. Energy Information Administration and Baker Hughes Inc.
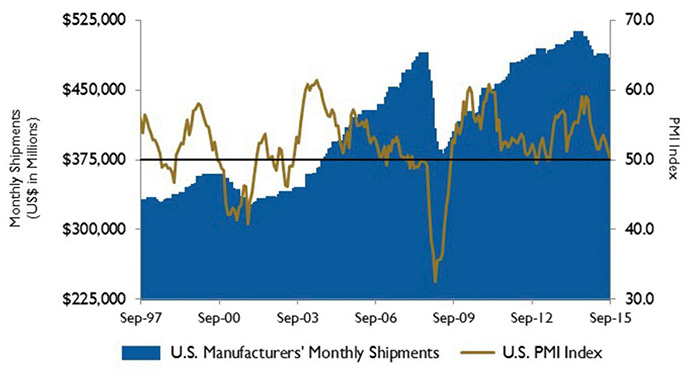 Figure 3. U.S. PMI and manufacturing shipments
Source: Institute for Supply Management Manufacturing Report on Business® and U.S. Census Bureau
Oil prices remained high enough in the second quarter of the year to support continued drilling in the core areas of the Bakken, Eagle Ford, Niobrara and Permian regions. However, total U.S. crude oil production started to decline in May. The U.S. Energy Information Administration expects U.S. crude oil production to generally decline through August 2016, when total production is forecast to average 8.7 million barrels per day.
On Wall Street, the Dow Jones Industrial Average was down 1.5 percent, the S&P 500 Index declined 2.6 percent and the NASDAQ Composite fell 3.4 percent for the month of September.
While the indices started the third quarter on a positive note, they lost their momentum as the quarter progressed as the Dow Jones Industrial Average fell 7.6 percent, the S&P 500 Index declined 6.9 percent and the NASDAQ Composite lost 7.4 percent for the quarter. Weak manufacturing data in China, disappointing trade data and factory output, along with a decline in industrial output dampened investor sentiment.
Reference
1. The S&P Return figures are provided by Capital IQ.