


The Jordan Knauff & Company (JKC) Valve Stock Index was up 34.7% over the last 12 months, while the broader S&P 500 index was up 16.5%. The JKC pump stock index gained 38.1% for the same time period.1
The Institute for Supply Management’s Purchasing Managers Index (PMI) registered 49% in September, up from 47.6% last month and down from 50.9% one year ago. This is a change of 2.9% from last month and -3.7% from one year ago. September marked the eleventh straight month that the PMI remained below 50%.
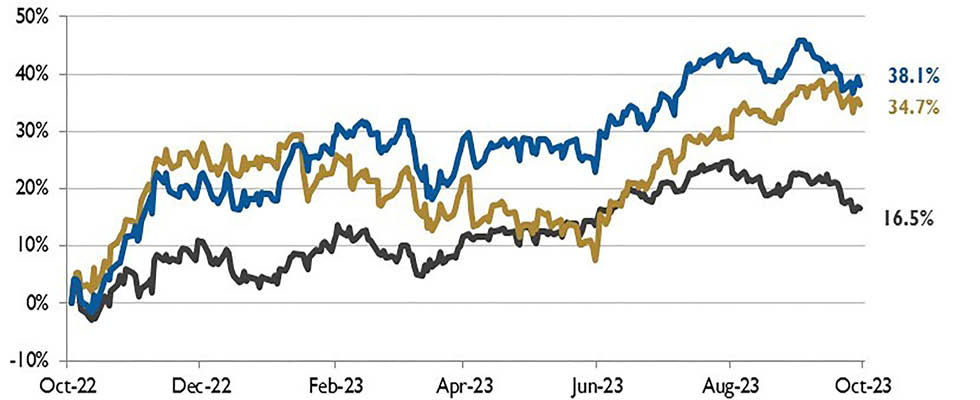
Local currency converted to USD using historical spot rates. The JKC Pump and Valve Stock Indices include a select list of publicly traded companies involved in the pump & valve industries, weighted by market capitalization. Source: Capital IQ and JKC research.
Five manufacturing industries in the survey reported growth, including textile mills and primary metals. New orders increased to 49.2% from 46.8% in August. The production index increased to 52.5% from 50% in the prior month. Prices paid by manufacturers fell to 43.8% from 48.4% in August. After slumping to a three-year low in July, employment rose to 51.2%.
The Commerce Department reported construction spending increased 0.5% in August after rising 0.9% in July, lifted by spending on single- and multi-family housing. Construction spending jumped 7.4% on a year-on-year basis. Spending on private construction projects rose 0.5%, with investment in residential construction advancing 0.6% after increasing 1.6% in the prior month. Private construction spending gained 1.2% in July. Spending on private non-residential structures climbed 0.3% in August, while spending on manufacturing construction projects jumped 1.2%.
The first half of 2023 saw the most United States petroleum product exports during the first six months of any year since 1981. Propane was the most exported U.S. petroleum product, averaging 1.5 million barrels per day and continuing a trend that began in 2020. Exports of other major petroleum products such as motor gasoline, distillate fuel oil and jet fuel all decreased compared with the first half of 2022.
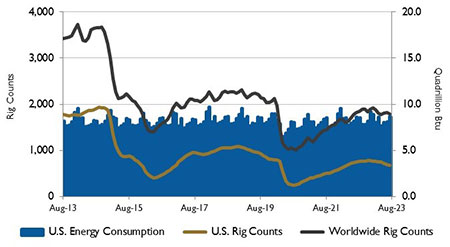
Source: U.S. Energy Information Administration and Baker
Hughes Inc.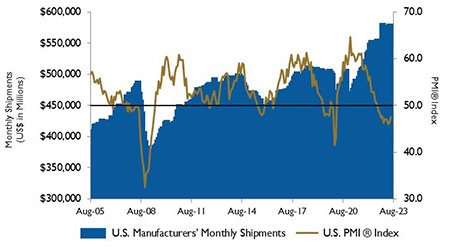
Source: Institute for Supply Management Manufacturing Report
on Business and U.S. Census Bureau
The U.S. exported more natural gas in the first half of 2023 than it did in the same period of any previous year. Natural gas exports averaged 4% more than in the first half of last year. Liquefied natural gas (LNG) exports drove the continued growth in total natural gas exports, although natural gas exports by pipeline also increased.
On Wall Street for the month of September, the Dow Jones Industrial Average, the S&P 500 and the Nasdaq Composite declined 3.5%, 4.9% and 5.8%, respectively. It was the biggest monthly percentage drop in 2023 for the S&P 500 and the Nasdaq. For the third quarter, the Dow lost 2.6%, the S&P 500 dropped 3.6% and the Nasdaq fell 4.1%. The prices, excluding the food and energy (PCE) inflation index, showed that underlying inflation moderated in August, with an annual rise in PCE of 3.9%. The number fell below 4% for the first time in more than two years.
Reference
The S&P Return figures are provided by Capital IQ.